On-chain Metrics: HOLD Waves, NUPL, NVT Ratio
Key Insights
- HODL Waves analysis provides insight into how crypto holders react to price changes and market trends, potential trend changes, or a distribution phase in the market.
- NUPL shows whether crypto holders are in profit or loss and how this affects market movements.
- The NVT ratio shows the relationship between network activity and the market cap of a crypto. Analysts and traders use NVT to evaluate the prospects of crypto and learn about how actively the blockchain is used.
This article describes metrics that provide insights into market analysis and trading decisions based on holder behavior, profit/loss differentials, and network activity evaluation.
What Is HODL Waves
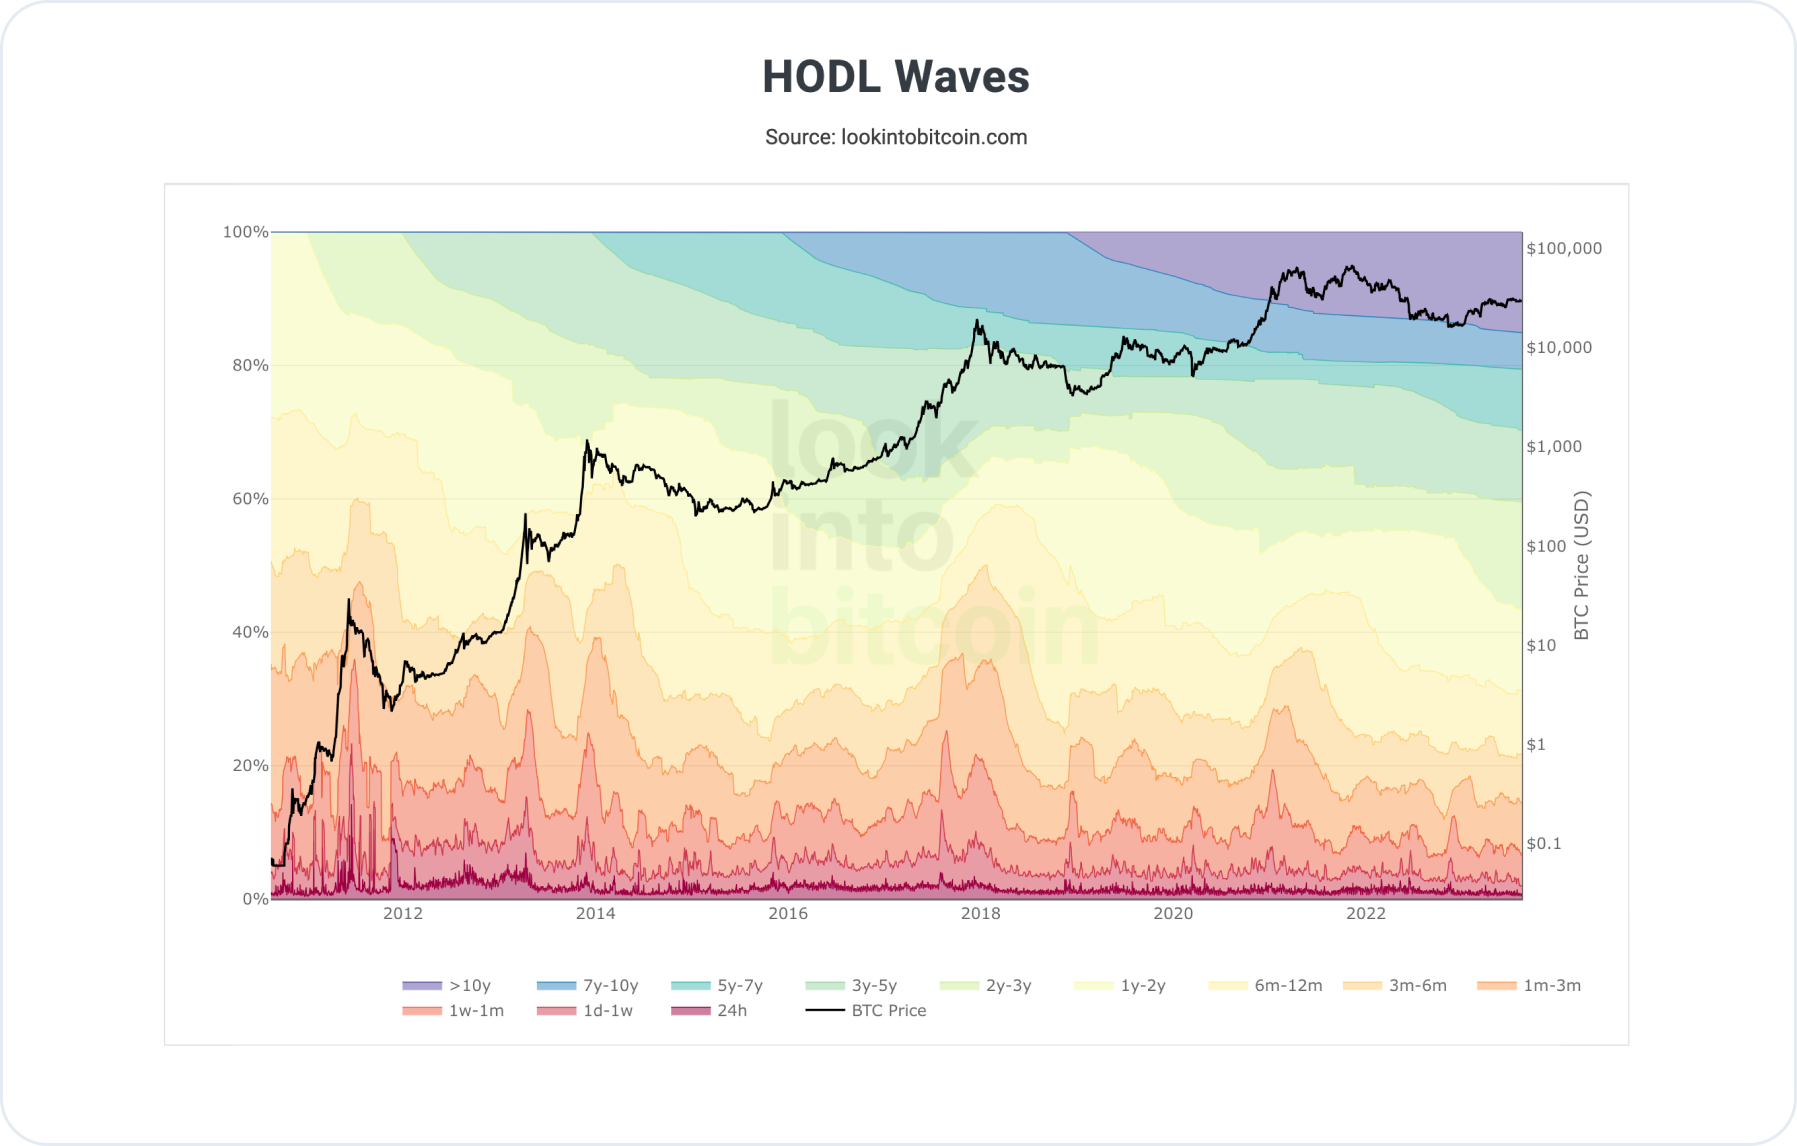
HODL Waves provides the dynamics of crypto holding across various stages of its evolution. HODL Waves is an analytical tool that categorizes the total available crypto into groups based on how long they have been held in the same wallets.
The term HODL originated from a typo of the word hold in a BitcoinTalk forum post and has come to symbolize the strategy of holding onto crypto for the long term, regardless of short-term price fluctuations.
To grasp HODL Waves, imagine all BTC coins divided into temporal categories: new coins (emission), long-held coins, coins in circulation for a moderate duration, and old coins (long-term holders). Each category has its own "age," measured in blocks or days.
HODL Waves helps us understand how crypto holders respond to price changes and market trends. When old coins that have remained dormant for a significant period begin to move, this could signal a potential shift in trend or the activity of major holders.
Conversely, if coins that have been in circulation for a while start accumulating in specific hands (such as large investors), it may suggest that the crypto market is entering an accumulation or distribution phase.
Applying HODL Waves
Analysts and traders actively employ HODL Waves to forecast crypto market movements. For instance, if old coins start moving actively, it might indicate an imminent short-term price correction. If long-term holders continue to retain their coins, it could reflect enduring confidence in the project's prospects.
Whether you're an investor, trader, or simply interested in the crypto world, comprehending HODL Waves can provide a deeper understanding of price movements and market trends. Integrating this metric into your strategy can enhance your ability to adapt to changing market conditions.
What Is NUPL
One of the most informative metrics is Net Unrealized Profit/Loss (NUPL). This metric aids in assessing whether crypto holders are in profit or loss and how it impacts market movements.
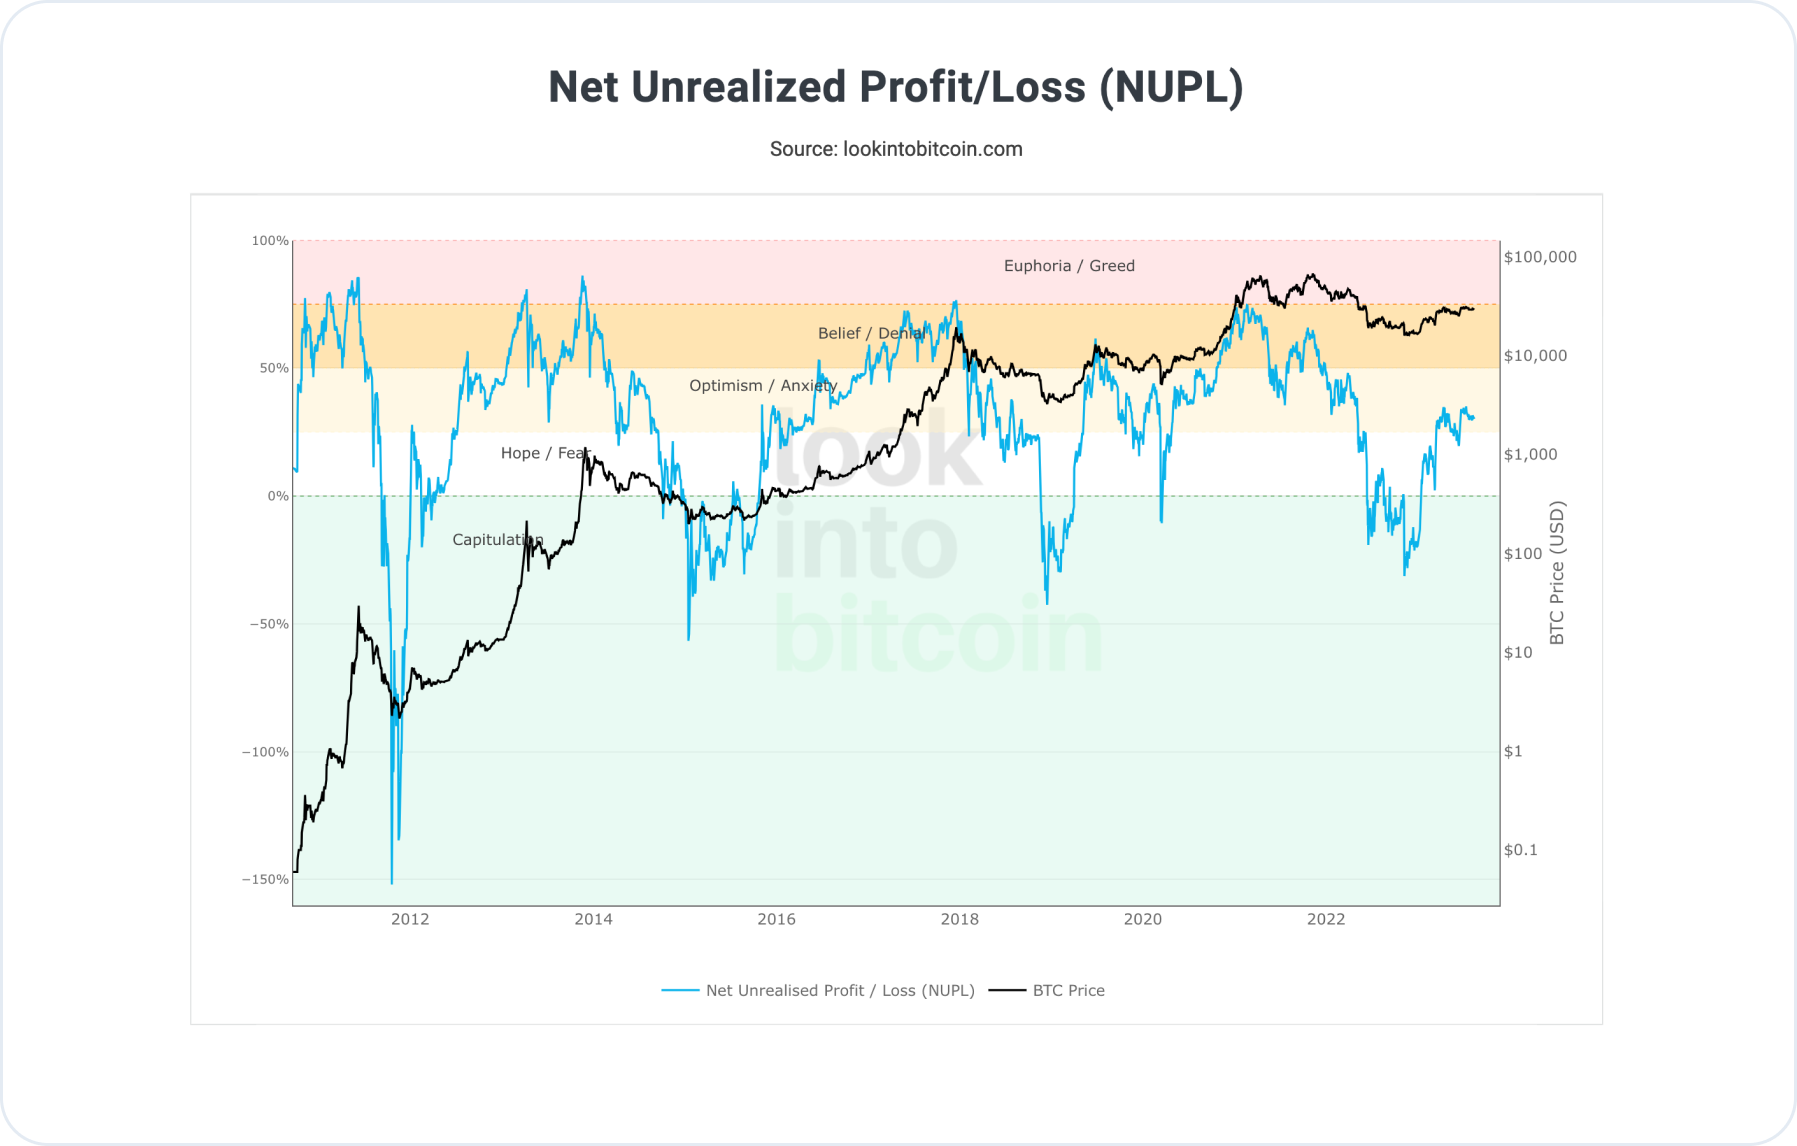
NUPL measures the difference between unrealized profit and loss among holders of specific volumes of cryptocurrency.
Unrealized profit is the variance between the current crypto price and the price at which it was acquired. NUPL aggregates this information for specific price ranges, enabling an evaluation of holder sentiment and behavior.
How Net Unrealized Profit/Loss (NUPL) works
NUPL can be depicted as a graph illustrating how many holders are in profit or loss based on the current crypto price. The NUPL graph can assist in identifying key levels where holders start to exit losses or lock in profits.
Applying NUPL
NUPL aids in understanding how long holders have sustained their assets in loss or vice versa, and how this might influence future price movements.
Analysts and traders utilize NUPL to assess the current market state and gauge how long cryptocurrency holders are willing to endure asset losses. This assessment can help determine how far the price may drop before holders initiate selling. Additionally, NUPL can be employed to identify potential entry and exit points for positions.
What Is NVT Ratio
NVT Ratio stands for "Network Value to Transactions Ratio," representing the ratio between network value and transaction volume.
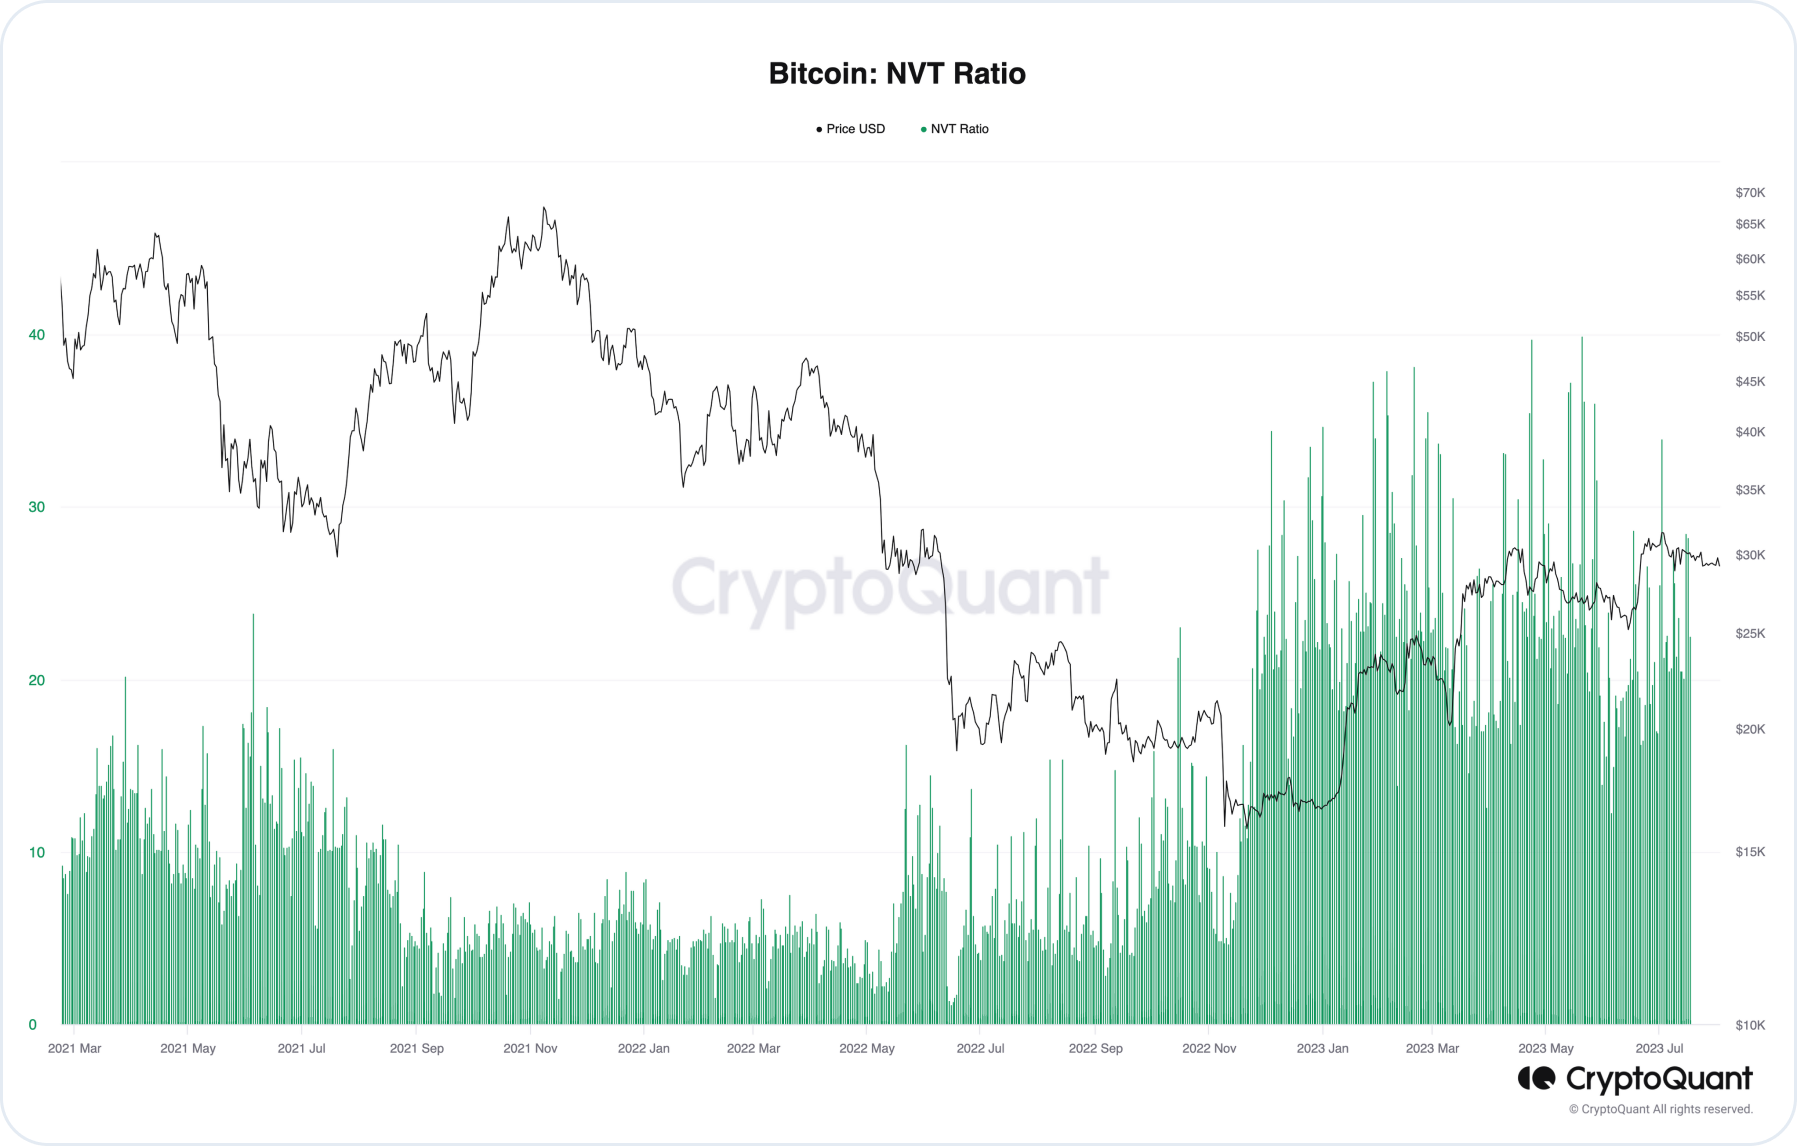
The NVT Ratio is a metric that assesses the relationship between network activity and crypto market cap, similar to how the Price to Earnings (P/E) ratio in traditional finance evaluates stock price stability. This metric can be valuable for crypto market analysis and investment decisions, aiding you in more informed crypto price evaluation and movement forecasting.
How NVT Ratio Works
Understanding the NVT Ratio can be seen as a way to measure so-called blockchain efficiency.
A high NVT Ratio might indicate that crypto market cap significantly surpasses transaction volume, signaling potential overvaluation and price correction. Conversely, a low NVT Ratio might suggest crypto undervaluation and growth potential.
Applying NVT Ratio
Analysts and traders often utilize the NVT Ratio to assess the prospects of various cryptocurrencies. When the NVT Ratio deviates significantly from its typical value, it can serve as a signal for further analysis. If a cryptocurrency's price is rising and the NVT Ratio is also increasing, it may serve as a warning of potential market overheating.
The NVT Ratio provides insights into how actively a specific crypto's blockchain is utilized and evaluates how "fairly" a crypto's price aligns with its network activity.
Users can get BTC and other cryptocurrencies for fiat or crypto on SimpleSwap.
Summary
In this article we looked into the essential crypto metrics. We’ve described in detail HODL Waves, NUPL (Net Unrealized Profit/Loss), and NVT ratio (Network Value to Transactions Ratio).
HODL Waves allows for categorisation of available crypto. NUPL gives insight of how to assess whether crypto holders are in profit or loss.
NVT ratio is a ratio between network value and transaction volume. All three metrics serve as tools of forecasting market movements.
The information in this article is not a piece of financial advice or any other advice of any kind. The reader should be aware of the risks involved in trading cryptocurrencies and make their own informed decisions. SimpleSwap is not responsible for any losses incurred due to such risks. For details, please see our Terms of Service.


