DOT Technical Analysis
Key Insights
- During the past three months DOT has seen a rise in price of 166%
- DOT is showing signs of temporary stabilization which happens thanks to the market’s sideways movement
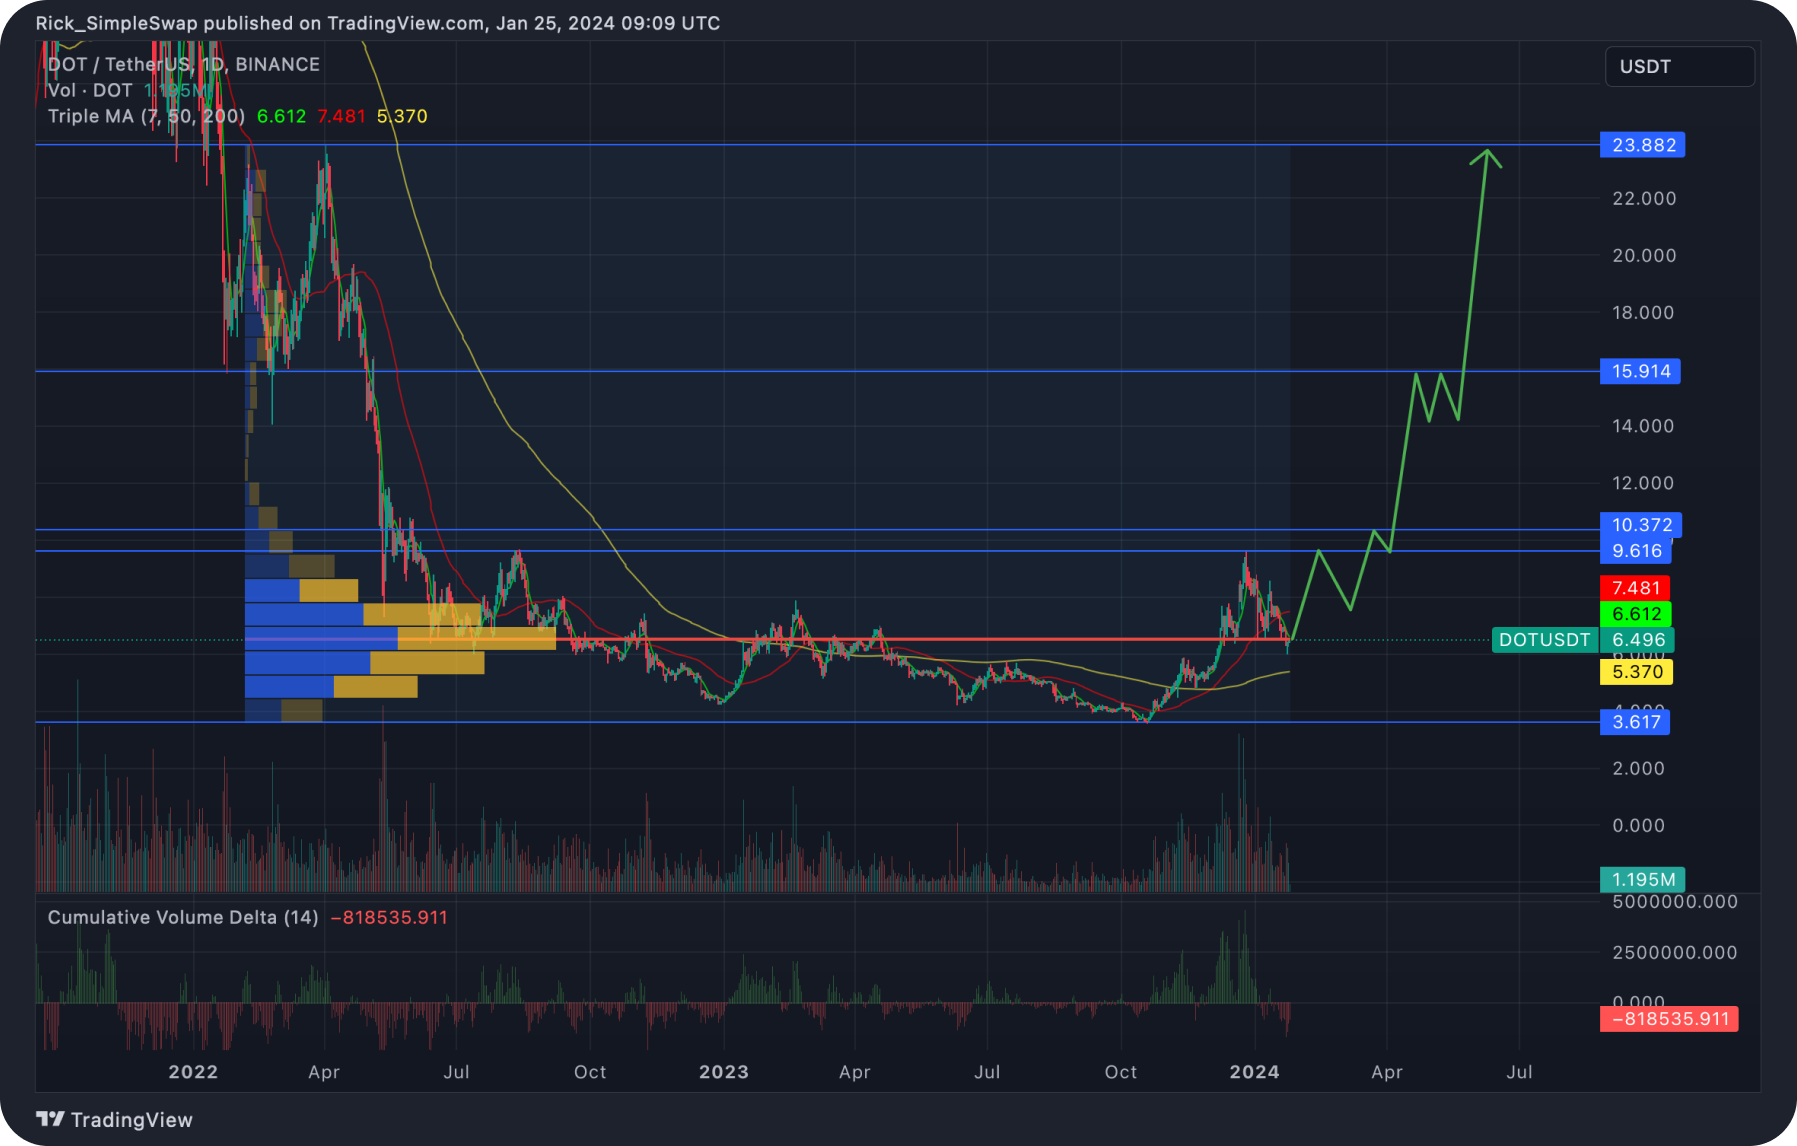
- If the uptrend stays stable DOT might see a price rise up to $23.882
As of writing, DOT holds the 12 position on CoinMarketCap ranking with a market cap of $8,236,138,499.
DOT Technical Analysis
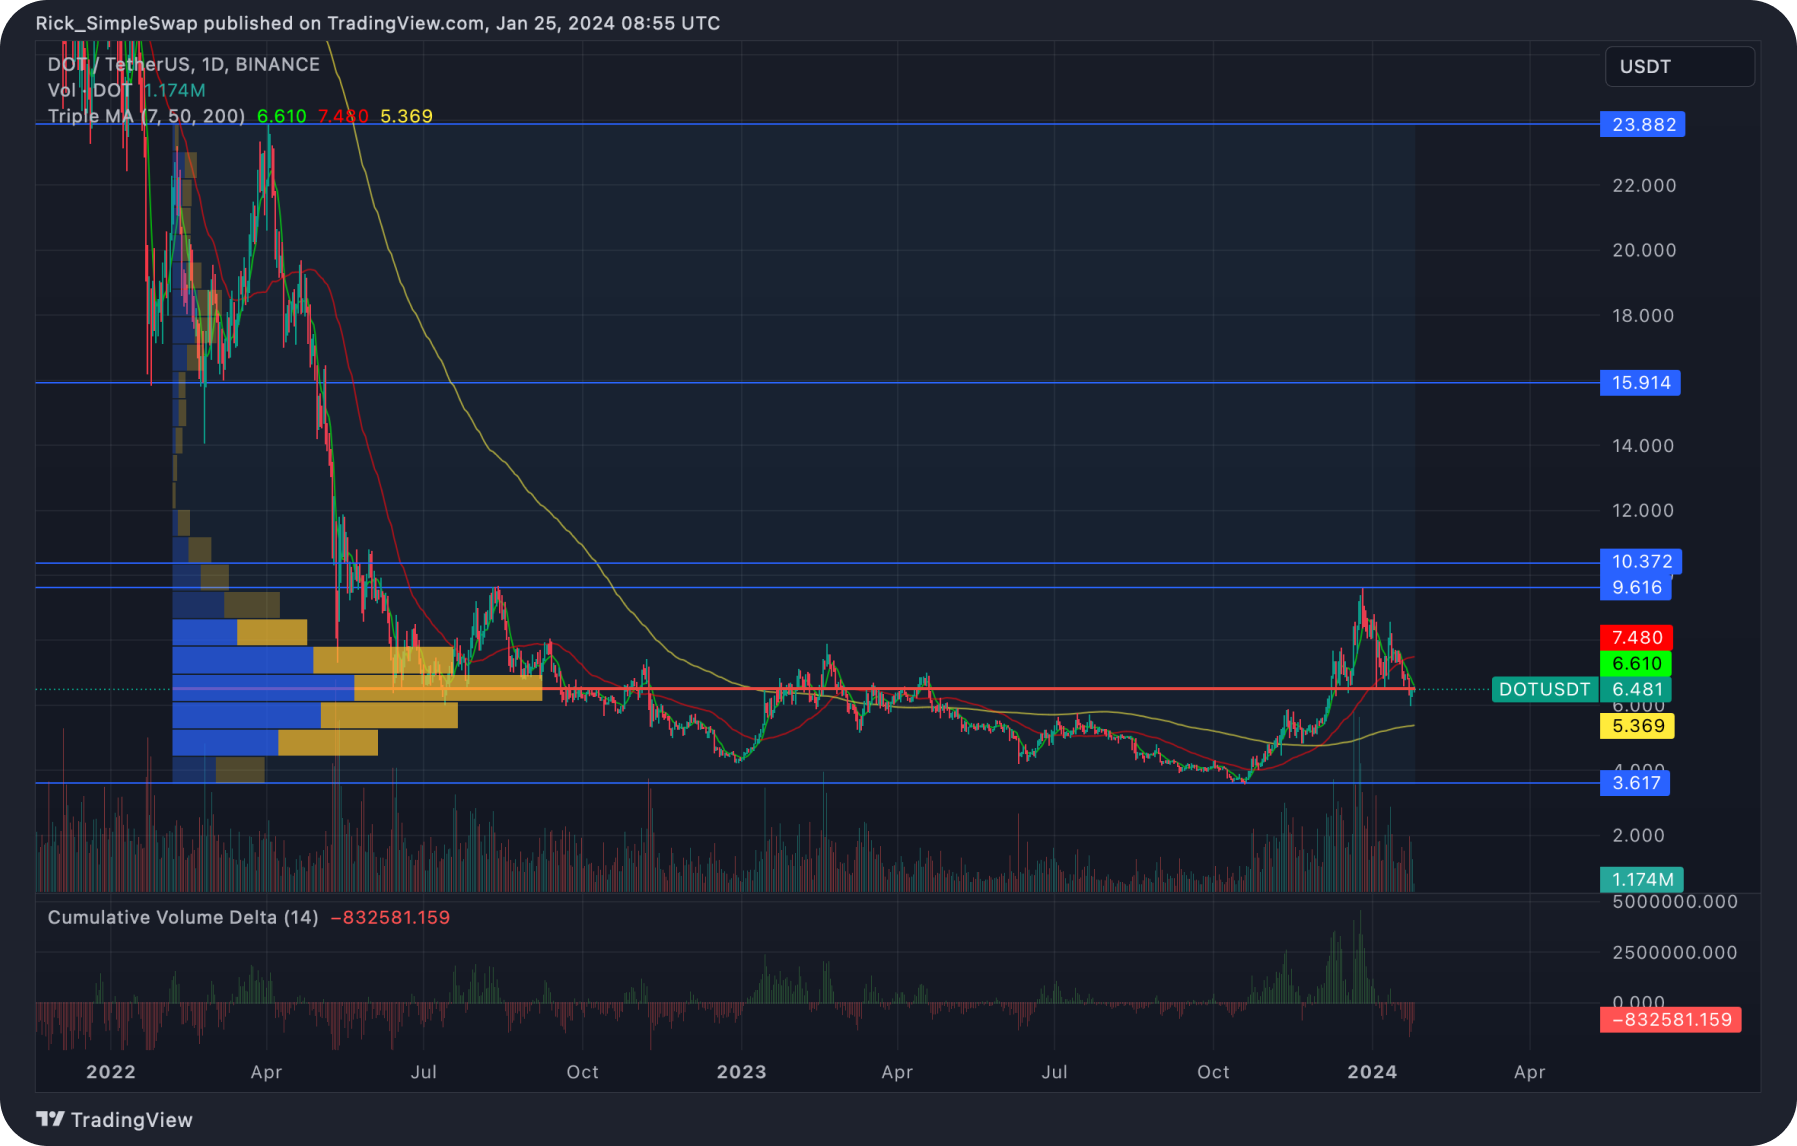
On the daily chart we can see that in mid-October 2023 the asset reached its own local lows at the price level of $3.617.

After that, there was a steady rise and it reached the price point of $9.616, which translates to more than 166% upside.
However, it is worth noting that the rate of decline slowed down noticeably in the previous period. The market began to form a sideways movement in a relatively narrow price range, which may indicate a change in dynamics and a transition to a more stable state.
The significant aspect of this sideways trend is the formation of significant profiles of trading volumes.
This indicates stability in this price range and emphasizes the potential growth of interest on the part of market participants. Such volumes may indicate investor and trader activity, expressed by interest in the current price level.
This period of sideways movement and the formation of large volumes can be interpreted as a temporary stabilization of the market, where investors assess the current situation and can prepare for a possible change in trend.
Such moments often precede periods of increased volatility or a change in price direction.
DOT Price Prediction
We presume that the DOT’s price will go up. We suggest neither buying nor selling the coin.

The first target for potential growth of this asset will be the level of local maximum of 2024, set at the price mark of $9.616.
If the asset successful overcomes this resistance level and fixes the price above it, we can expect movement to the next resistance level, which is located at the price mark of $15.914.
In case of formation of a stable uptrend and maintaining the strength of buyers, the asset may continue its growth and reach the target level at the price mark of $23.882.
Our skilled SimpleSwap analyst offers a trading scenario with DOT on TradingView.
Users can get DOT for fiat or crypto on SimpleSwap.
The information in this article is not a piece of financial advice or any other advice of any kind. The reader should be aware of the risks involved in trading cryptocurrencies and make their own informed decisions. SimpleSwap is not responsible for any losses incurred due to such risks. For details, please see our Terms of Service.


