BTC On-Chain Analysis Mid-March 2024
Key Insights
- The observed decline in the number of transactions in the Bitcoin network from early February to mid-March is accompanied by a continued rise in the BTC price
- The low MVRV Z-Score indicates the potential undervaluation of Bitcoin and suggests that much of the BTC price increase may still be to come
- The current moment may be a good time to accumulate Bitcoin, that is to buy or increase positions in the cryptocurrency
To perform the on-chain analysis we collected the on-chain data via such indicators as number of transactions, balance by holding, Bitcoin balance, MVRV Z-score, and Bitcoin rainbow price chart.
Number of BTC Transactions
BTC analysis shows that from early February through mid-March, there was a significant decline in the number of transactions on the Bitcoin network. During this period, the number of transactions decreased from a level of about 636,520 transactions to about 341,870 transactions. This occurred while the value of BTC continued to rise without a rollback.
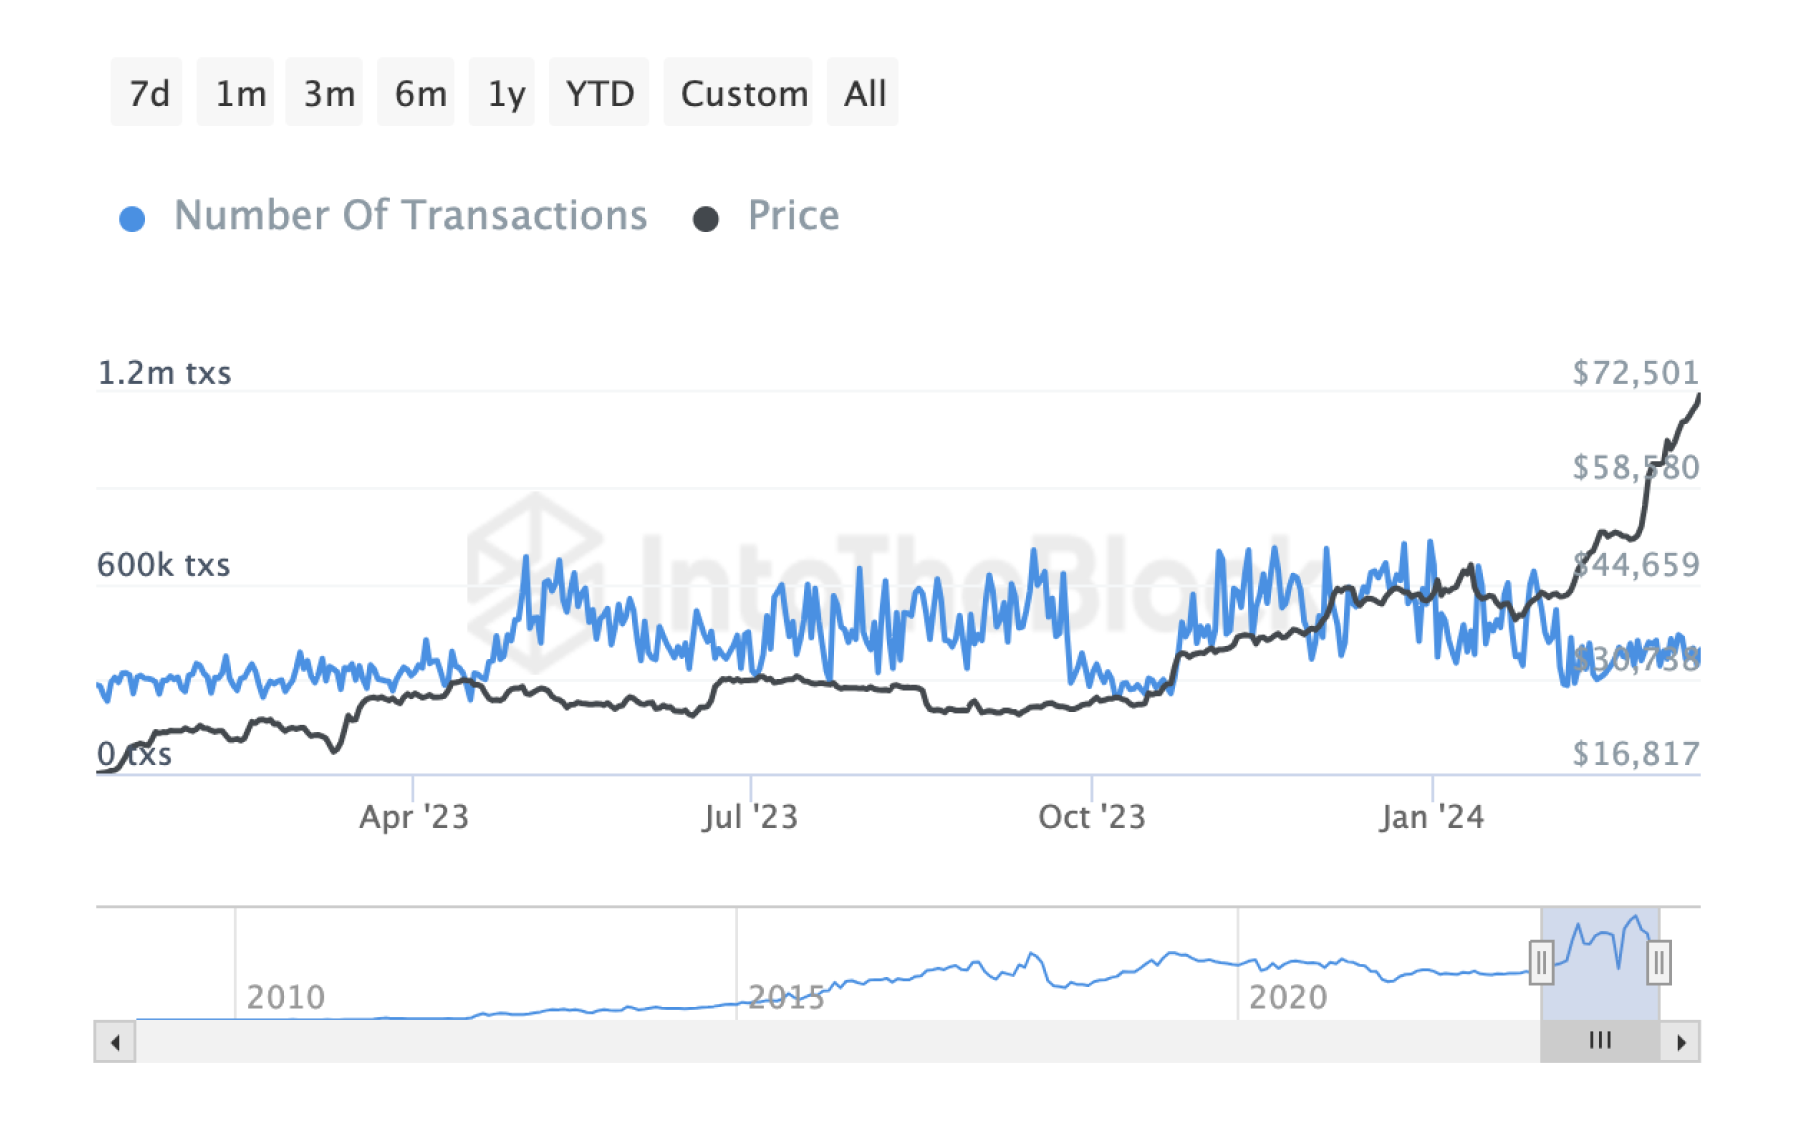
When the Bitcoin price rises, some investors prefer to hold on to their coins in anticipation of even greater price increases rather than spend them on transactions. This can lead to a decrease in the overall volume of transactions on the network.
With increasing interest from institutional investors who tend to hold BTC for the long term, the number of transactions may have decreased due to their more conservative approach to trading.
Bitcoin Balance by Holding
Information on changes in the total volume of cryptocurrency assets held at addresses belonging to different size ranges.
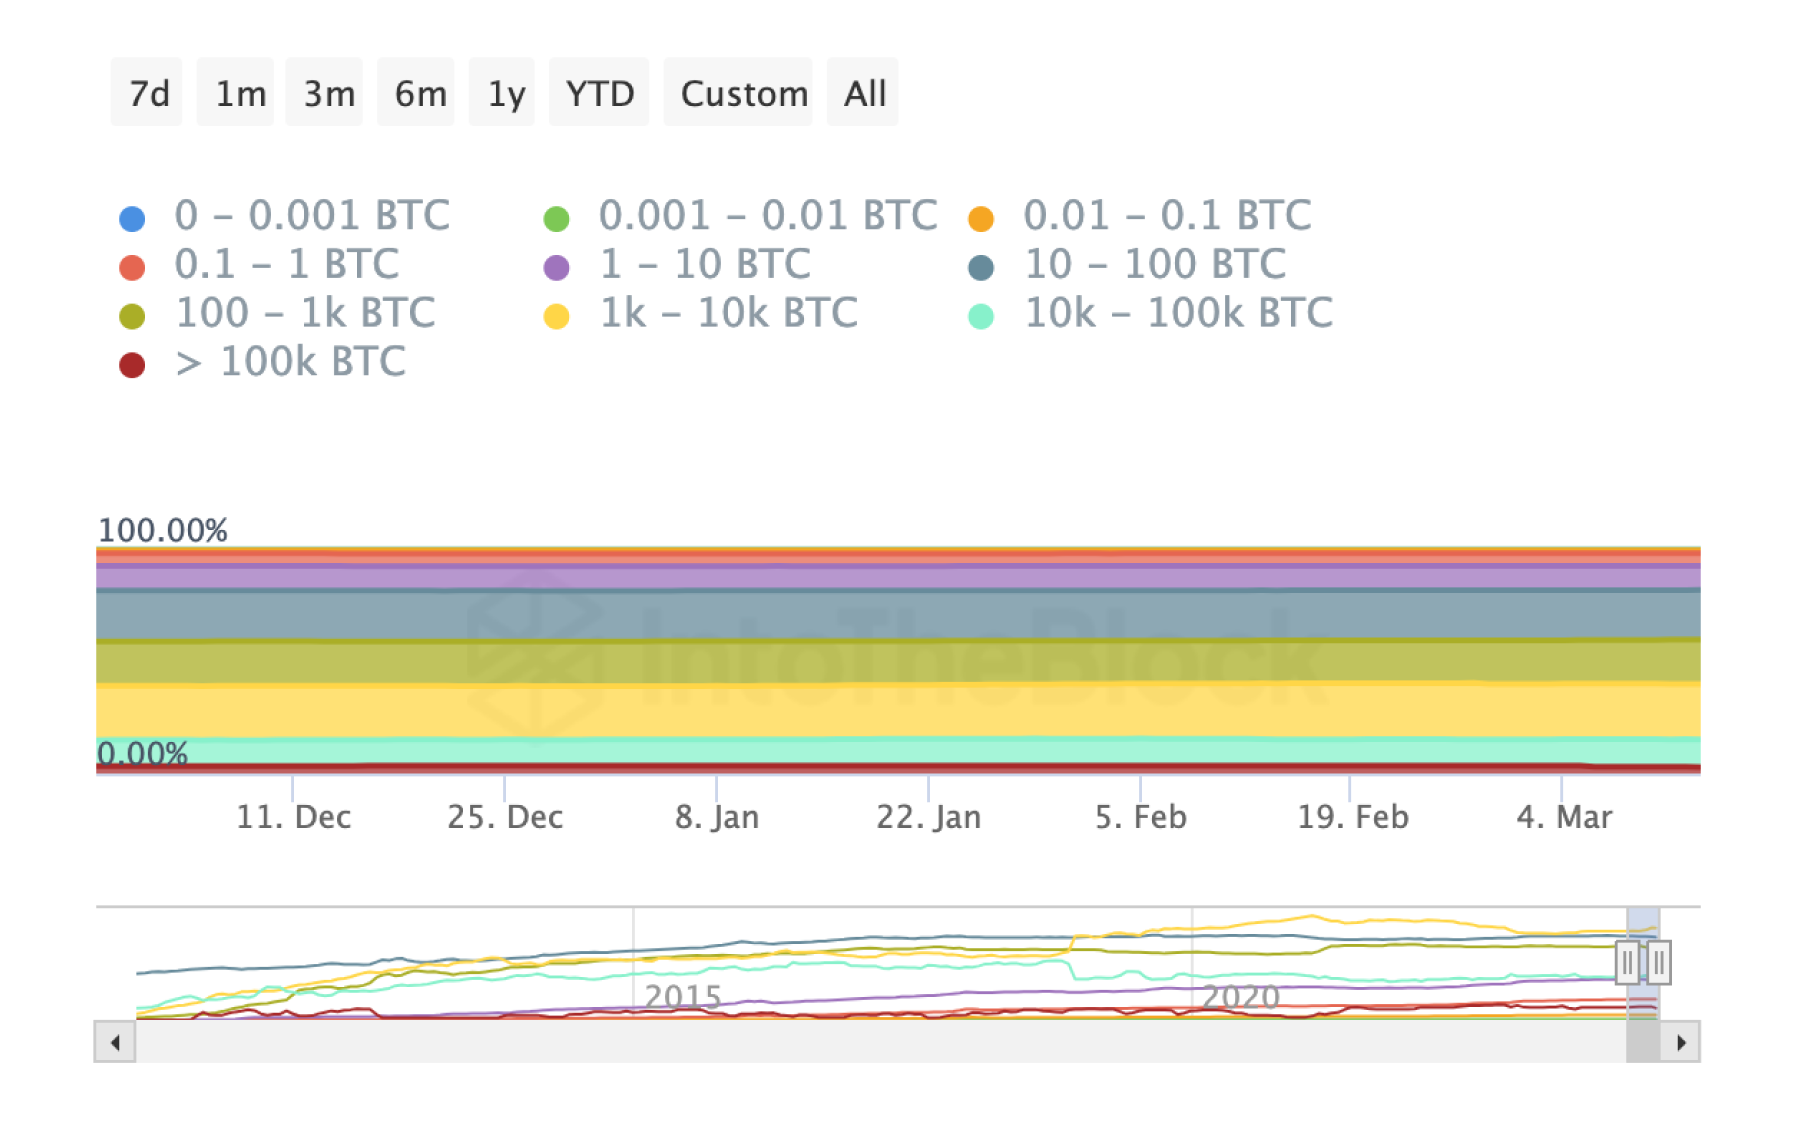
- From 0 to 0.001 BTC: Increase of 0.19%.
- From 0.001 to 0.01 BTC: Increase of 0.40%.
- From 0.01 to 0.1 BTC: 0.39% decrease.
- From 0.1 to 1 BTC: 0.62% decrease.
- From 1 to 10 BTC: 0.88% decrease.
- From 10 to 100 BTC: 0.74% decrease.
- From 100 to 1k BTC: Increase of 3.67%.
- From 1k to 10k BTC: 0.18% decrease.
- From 10k to 100k BTC: Increase of 3.16%.
- Over 100k BTC: 16.90% decrease.
The following interpretations can be made on this information about changes in the total volume of cryptocurrency assets held at addresses:
- The number of addresses with small amounts of BTC (from 0 to 0.001 BTC and from 0.001 to 0.01 BTC) has increased, which may indicate the mass purchase of small amounts of cryptocurrency.
- For addresses with BTC amounts between 0.01 and 1 BTC, there is a decline, which may indicate that some owners are realizing their cryptocurrency assets or moving them to other assets.
- For large cryptocurrency holders (100 to 1k BTC and 10k to 100k BTC), there is an increase in total assets, which may indicate a growing interest in investing or an increase in cryptocurrency ownership among large players.
- The total volume of cryptocurrency at addresses with amounts over 100k BTC has decreased significantly, which may indicate a reallocation of cryptocurrency assets by large owners or institutional players.
Bitcoin Balance
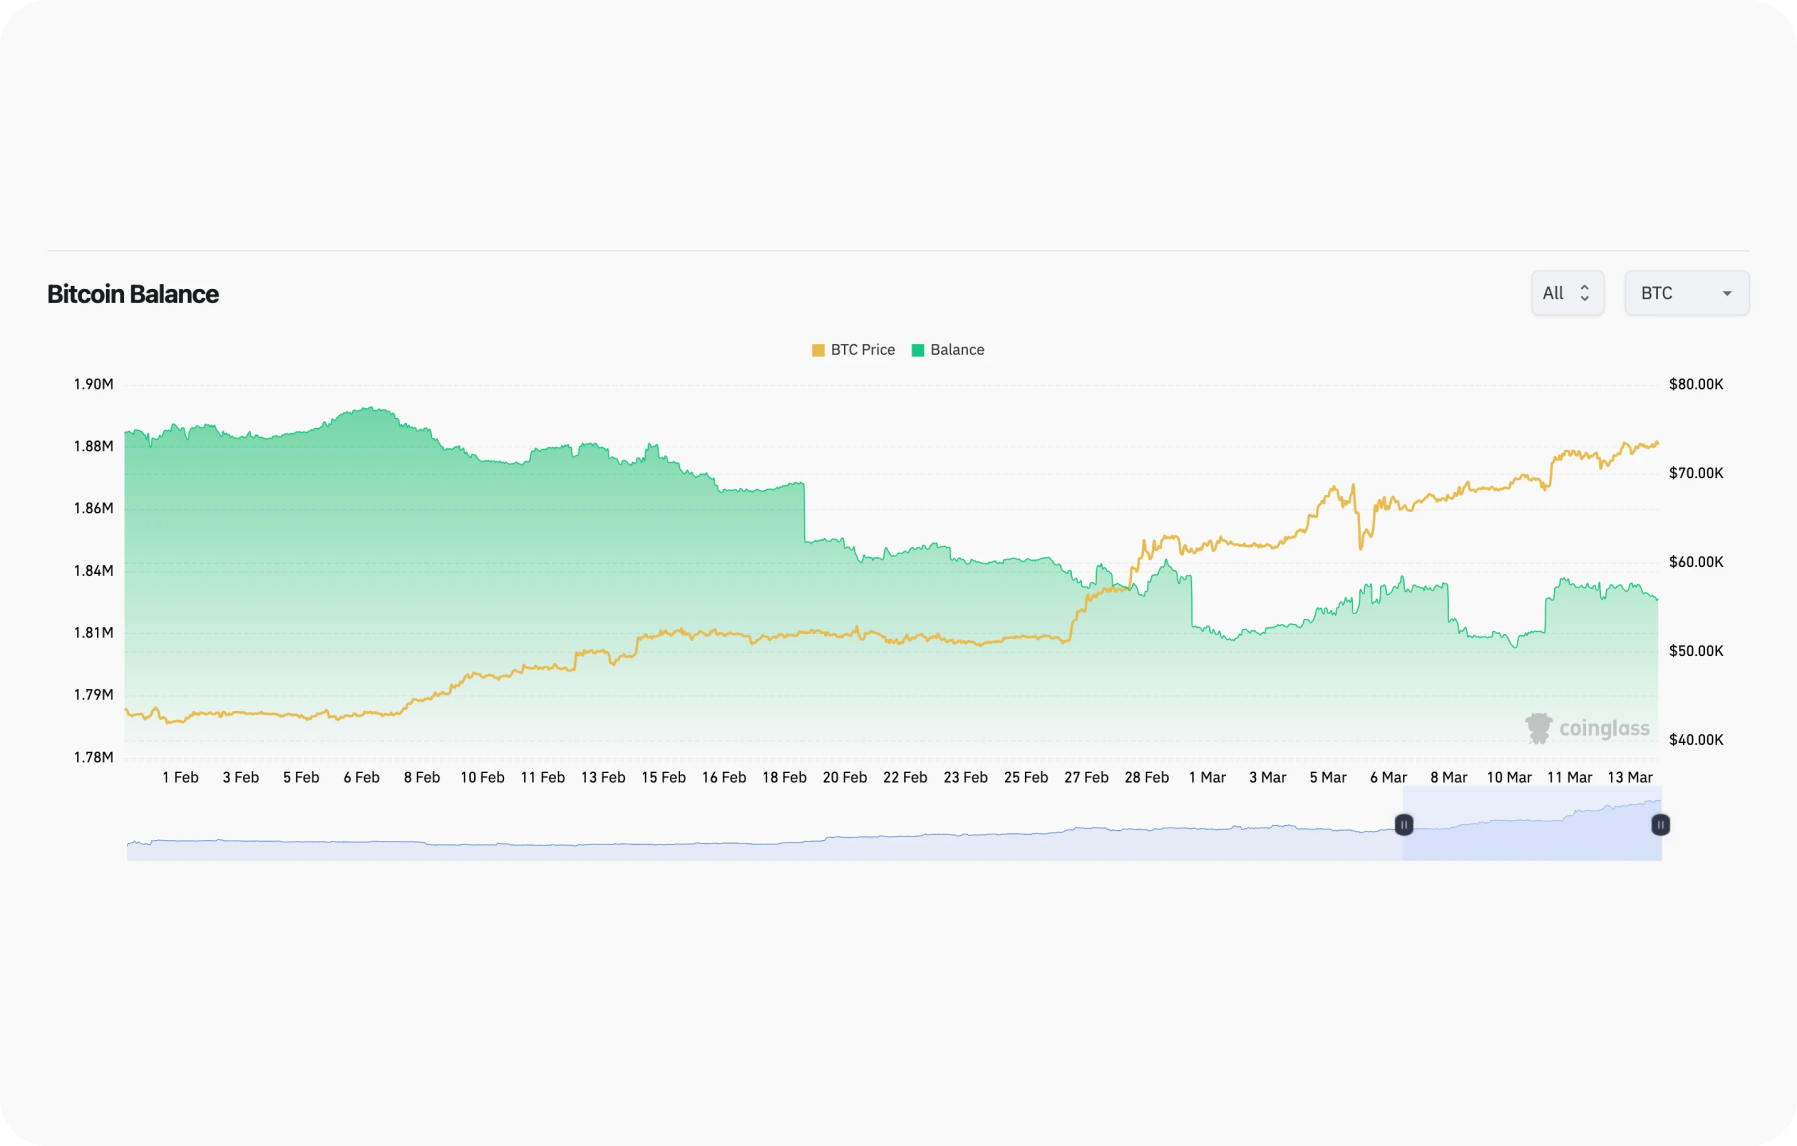
The decline in BTC balances on centralized exchanges as Bitcoin continues its relentless rise in value can be attributed to the following factors:
Preference for private wallets
With Bitcoin price on the rise, investors may prefer to store their assets in private wallets instead of exchanges to protect them from potential security threats or loss of access to assets. With full control over private keys, investors may feel more confident in the safety of their funds and avoid the risk associated with storing on centralized platforms.
This situation reflects investors' confidence in the long-term stability of the crypto market and the growth of BTC. The preference to hold assets in personal wallets instead of centralized exchanges indicates that investors see prospects for long-term growth in the Bitcoin price.
Bitcoin MVRV Z-Score
Given the current Z-Score value, which is at a relatively low level, it can be assumed that much of the BTC price growth is yet to come.
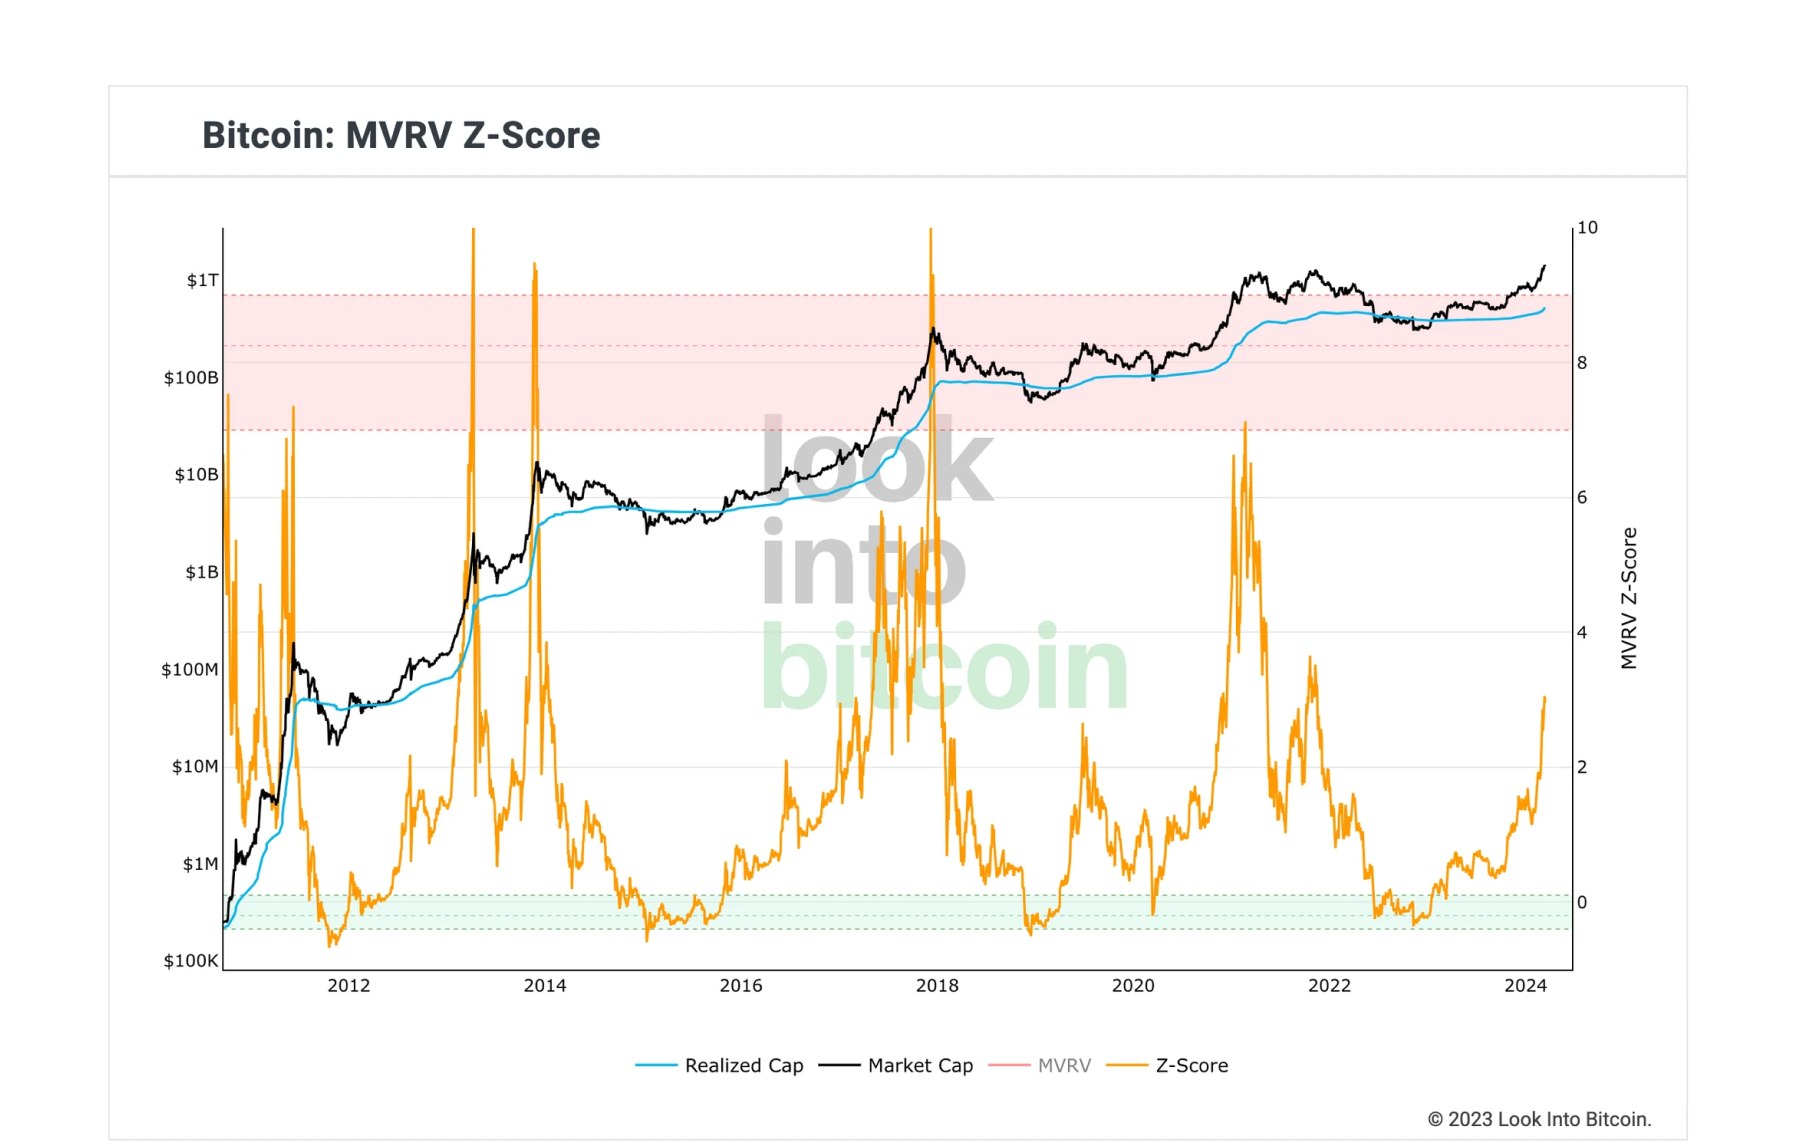
The MVRV Z-Score serves as an indicator to gauge the current valuation of the Bitcoin market relative to its average valuation. A low Z-Score value may indicate that Bitcoin is undervalued, which could bode well for potential price increases in the future.
Bitcoin Rainbow Price Chart Indicator
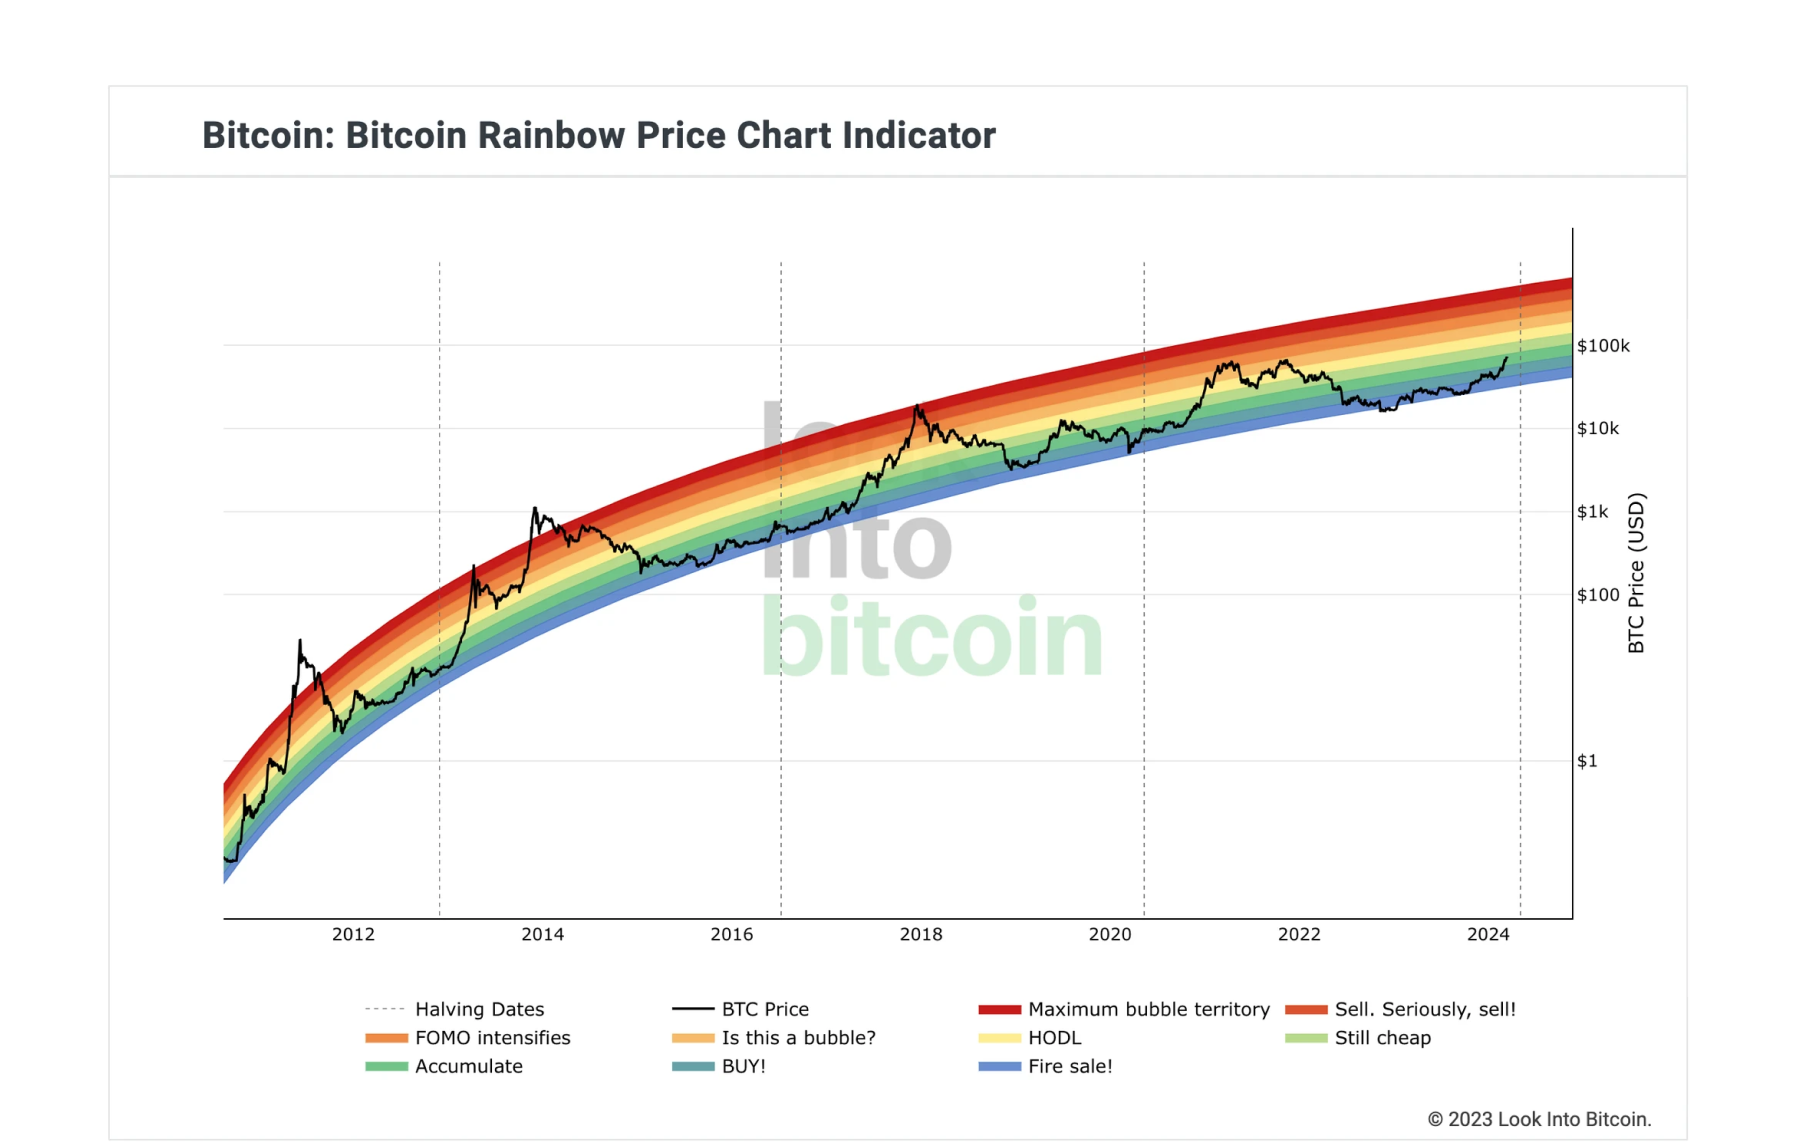
According to the Bitcoin Rainbow Price crypto chart indicator, which is based on analyzing Bitcoin price data using various moving averages and percentage ranges, we are currently in the accumulation zone. It is believed that prices are at a relatively low level and may increase in the future.
Summary
The decline in the number of Bitcoin transactions may be due to investors' preference to hold coins in anticipation of further price growth rather than use them for transactions. The decrease in the number of transactions may also be the result of a more conservative approach to trading on the part of institutional investors.
Analysis of BTC balances by owner addresses shows a variety of trends. An increase in balances at addresses with small amounts and large owners may indicate a growing interest in cryptocurrency investments. Decreasing balances on addresses with large amounts may indicate a redistribution of assets.
Declining BTC balances on centralized exchanges while the Bitcoin price continues to rise may indicate investors' preference to store assets in personal wallets. This may reflect their confidence in the stability of the crypto market.
According to the Bitcoin Rainbow Price Chart indicator, we are in the accumulation zone, which could mean a good time to accumulate Bitcoin in anticipation of further price growth.
Overall, the Bitcoin analysis data points to BTC growth potential in the future.
Users can get BTC for fiat or crypto on SimpleSwap.
The information in this article is not a piece of financial advice or any other advice of any kind. The reader should be aware of the risks involved in trading cryptocurrencies and make their own informed decisions. SimpleSwap is not responsible for any losses incurred due to such risks. For details, please see our Terms of Service.


