Comprehensive Technical Analysis for Trading Crypto
Key Insights
- Support and resistance levels, essential aspects of crypto charts, are formed by increasing numbers of buyers or sellers at key price zones. They tend to switch roles over time, with support becoming resistance and vice versa, a phenomenon crucial in cryptocurrency analysis.
- Types of crypto charts include head and shoulders pattern, flags, and triangles signal potential trend continuations or reversals. Identifying these patterns early can inform trading decisions and enhance the precision of crypto chart patterns analysis.
- Analyzing trading volumes, another significant element in crypto charts, provides insights into market interest and commitment to price moves. Increasing volume generally precedes price rises, while decreasing volume precedes price drops.
Crypto charts are powerful tools that traders use to analyze markets and make informed trading decisions. By studying price movements and patterns, traders can gain valuable insights into where prices may head next.
This text provides an overview of some of the most important concepts in analysis of crypto charts, including such types of crypto charts as head and shoulders pattern, triple tops, flags, and more. Understanding how to read crypto charts is fundamental for any market participants involved in cryptocurrency trading.
By combining crypto value analysis of crypto charts, price action, indicators, trading volume and chart patterns, investorscan develop robust market insights necessary for crypto trading. This equips them to trade in the overall market direction, accurately determine the time to enter and exit the position, set appropriate stop losses and profit targets.
Trading Crypto: Support and Resistance Levels
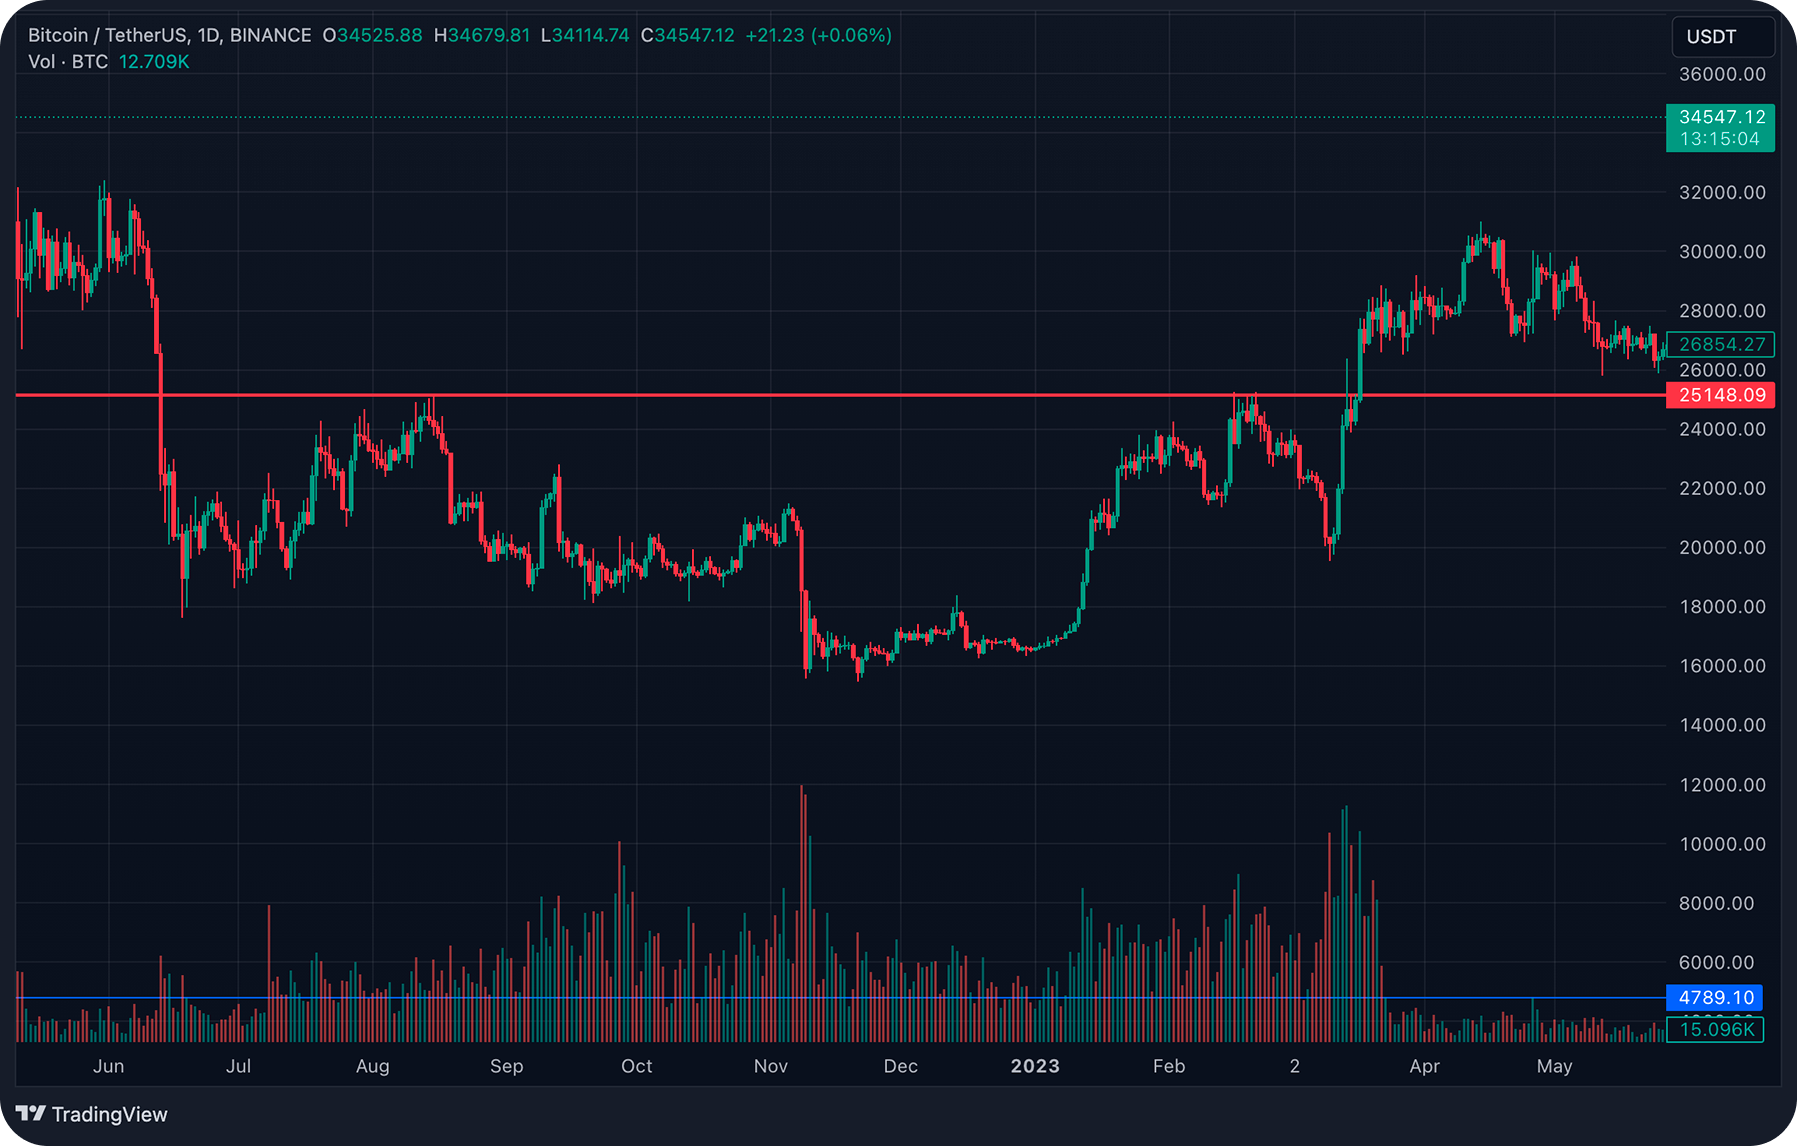
Support and resistance levels are important price zones where the asset’s price often changes position. This formation on a crypto chart can indicate further price movement.
Support and resistance levels can be pivot points, overbought zones, or psychologically important price zones.Applying this knowledge to crypto trading, it is generally believed that the older the timeframe, the more reliable the level. In addition, the number of price approaches and bounces adds value to the level.
Levels are formed by increasing numbers of buyers or sellers in key price zones. Support and resistance levels tend to switch roles with each other.
A support level is a pricing level on a crypto chart from which the price has bounced when moving in a downtrend, i.e., from the top to the bottom. To determine the level we need to find two local lows. These are two points to which the price falls, but below which it does not fall.
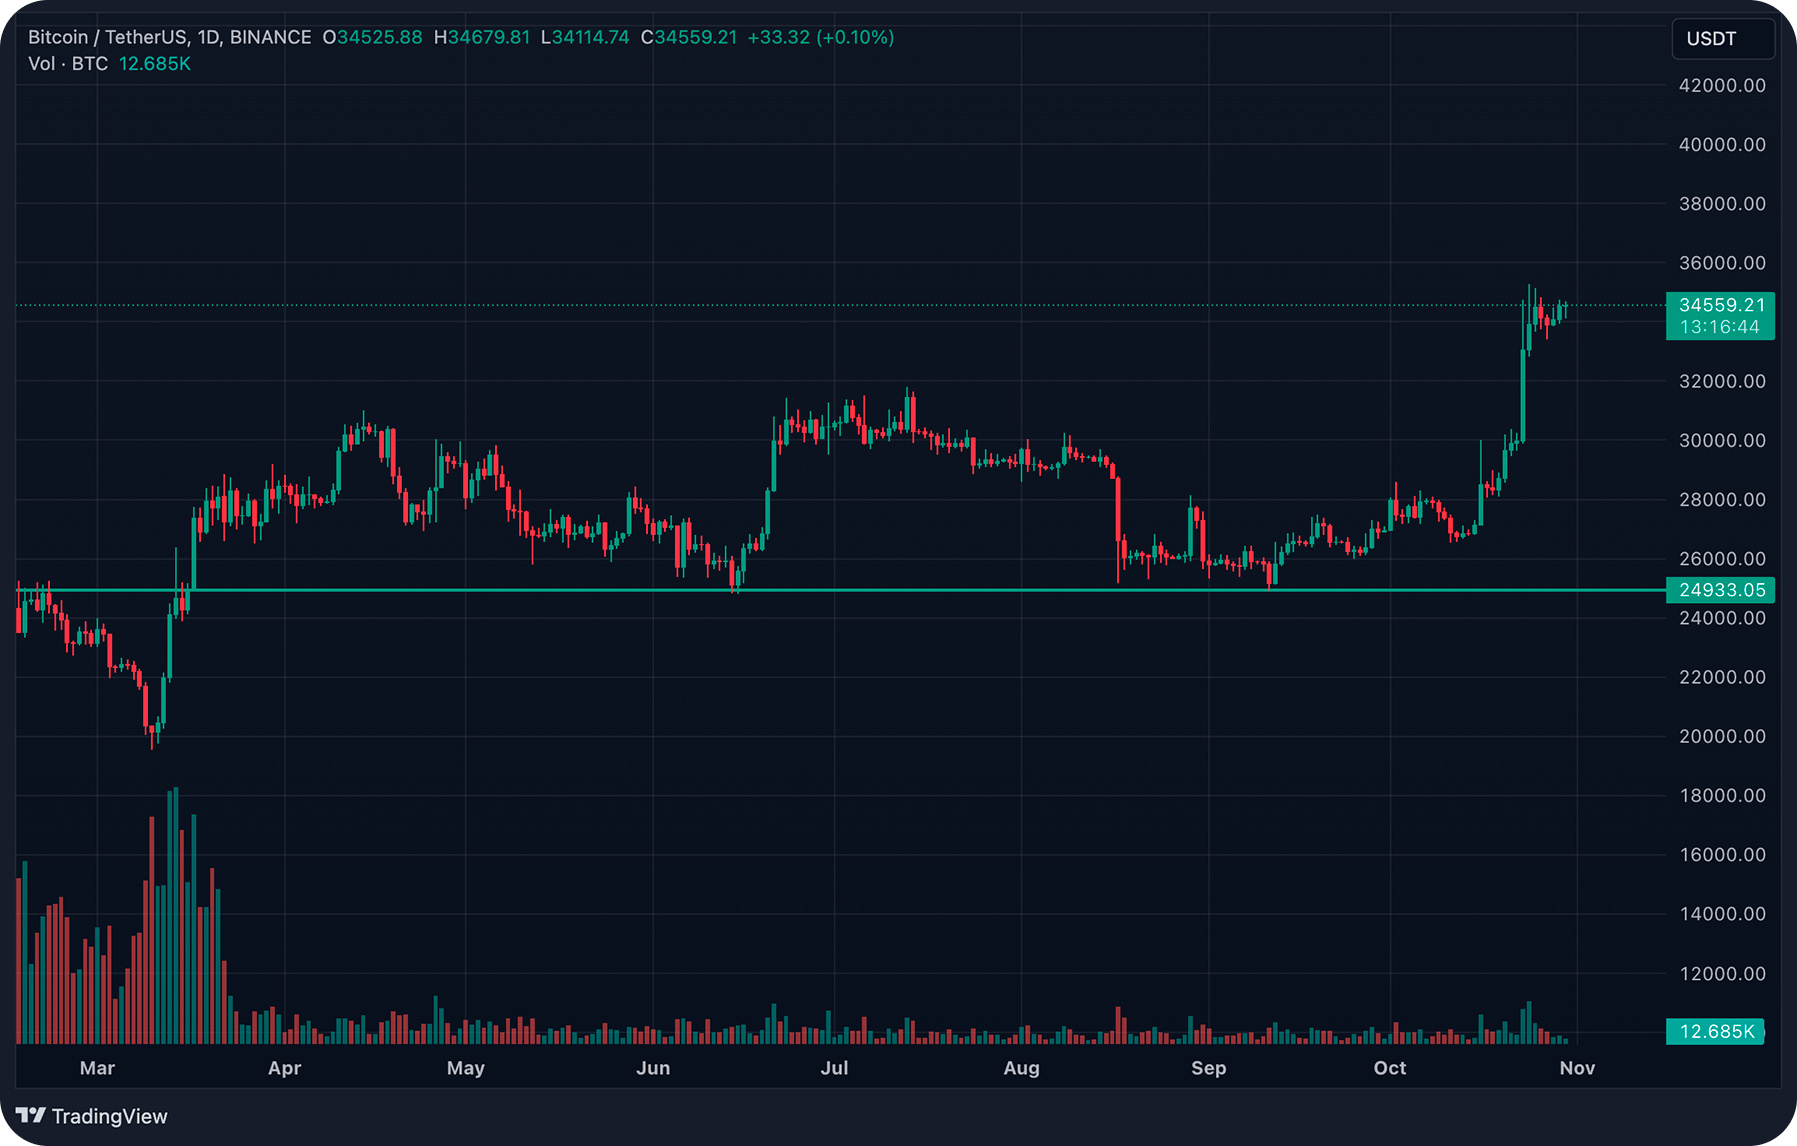
A resistance level is a pricing level on a crypto chart from which the price has bounced in an uptrend, i.e., from bottom to top. To determine the level it is necessary to find two local maximums. These are two points to which the price rises, but above which it does not go.
How to Build Levels for Crypto Charts
To build a support level, you have to find two local minimums (extremums) on a crypto chart from which the price alternately bounced upwards. A horizontal support line is drawn through these points.
To build a resistance level, you have to find two local maximums on a crypto chart from which the price alternately bounced down and draw a horizontal line of resistance through these points.
Levels should pass through at least two points of price extremums. This approach is one of the most popular tools for crypto charts analysis.
Patterns of Crypto Charts
Crypto charts are recurring formations that show the price behavior. They can signal potential opportunities.
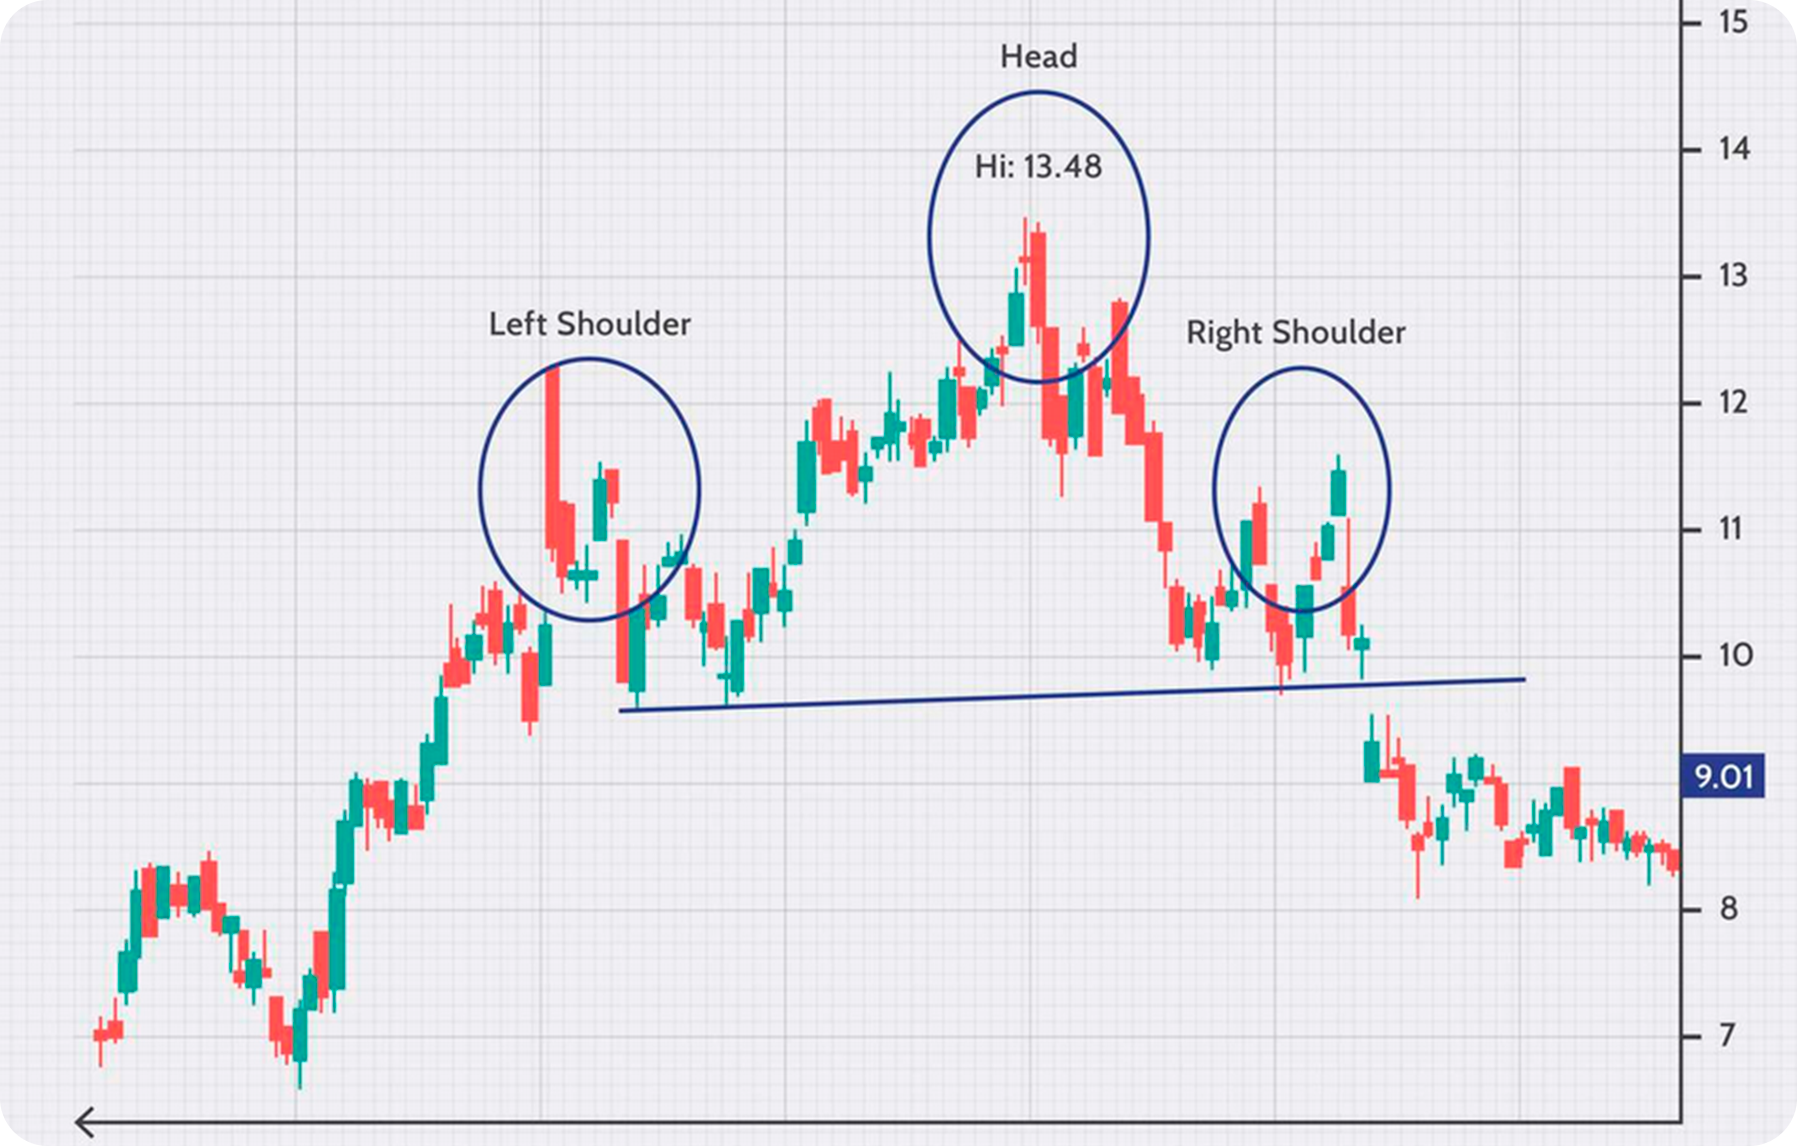
- Head and Shoulders Pattern
The Head and Shoulders pattern forms when a peak is sandwiched between two smaller peaks. It signals falling demand and an impending reversal of crypto trends.
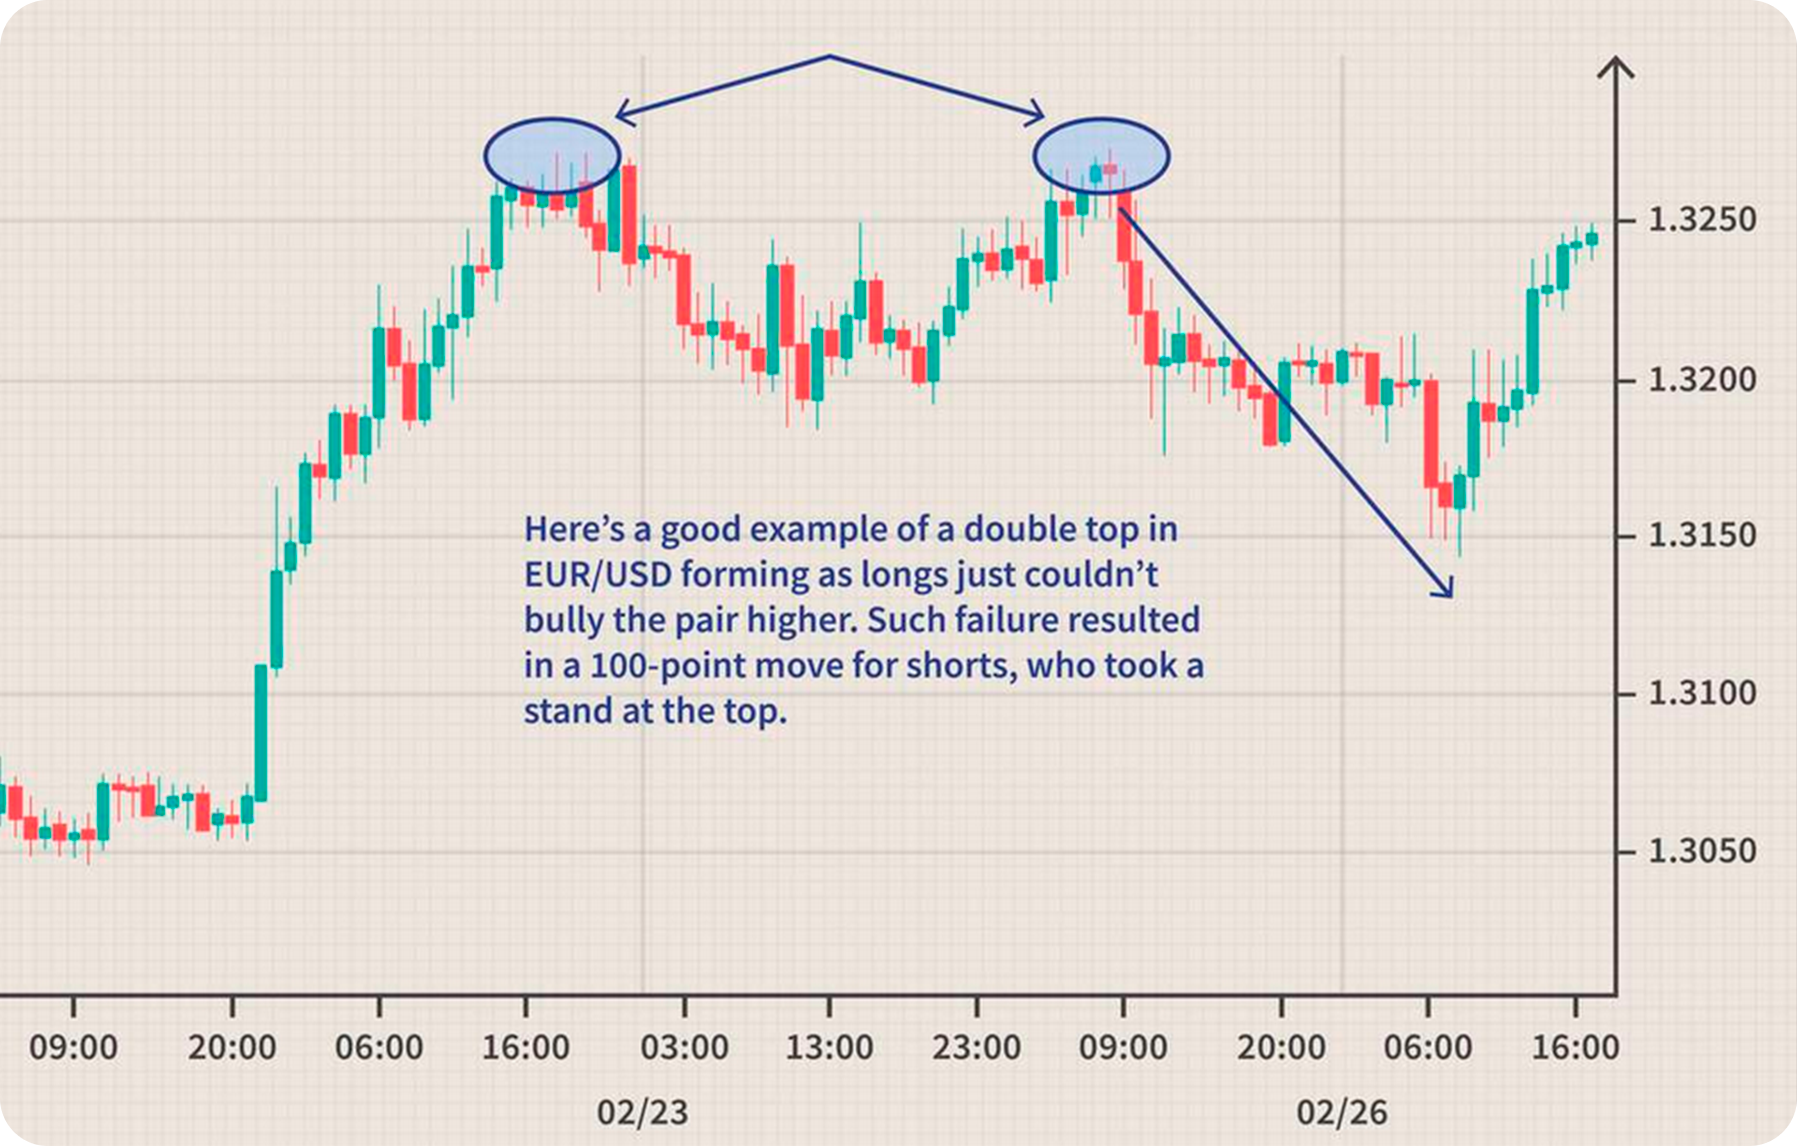
- Double Tops
Double Tops are characterized by two prominent peaks at approximately the same resistance level, indicating a potential reversal in the current trend.
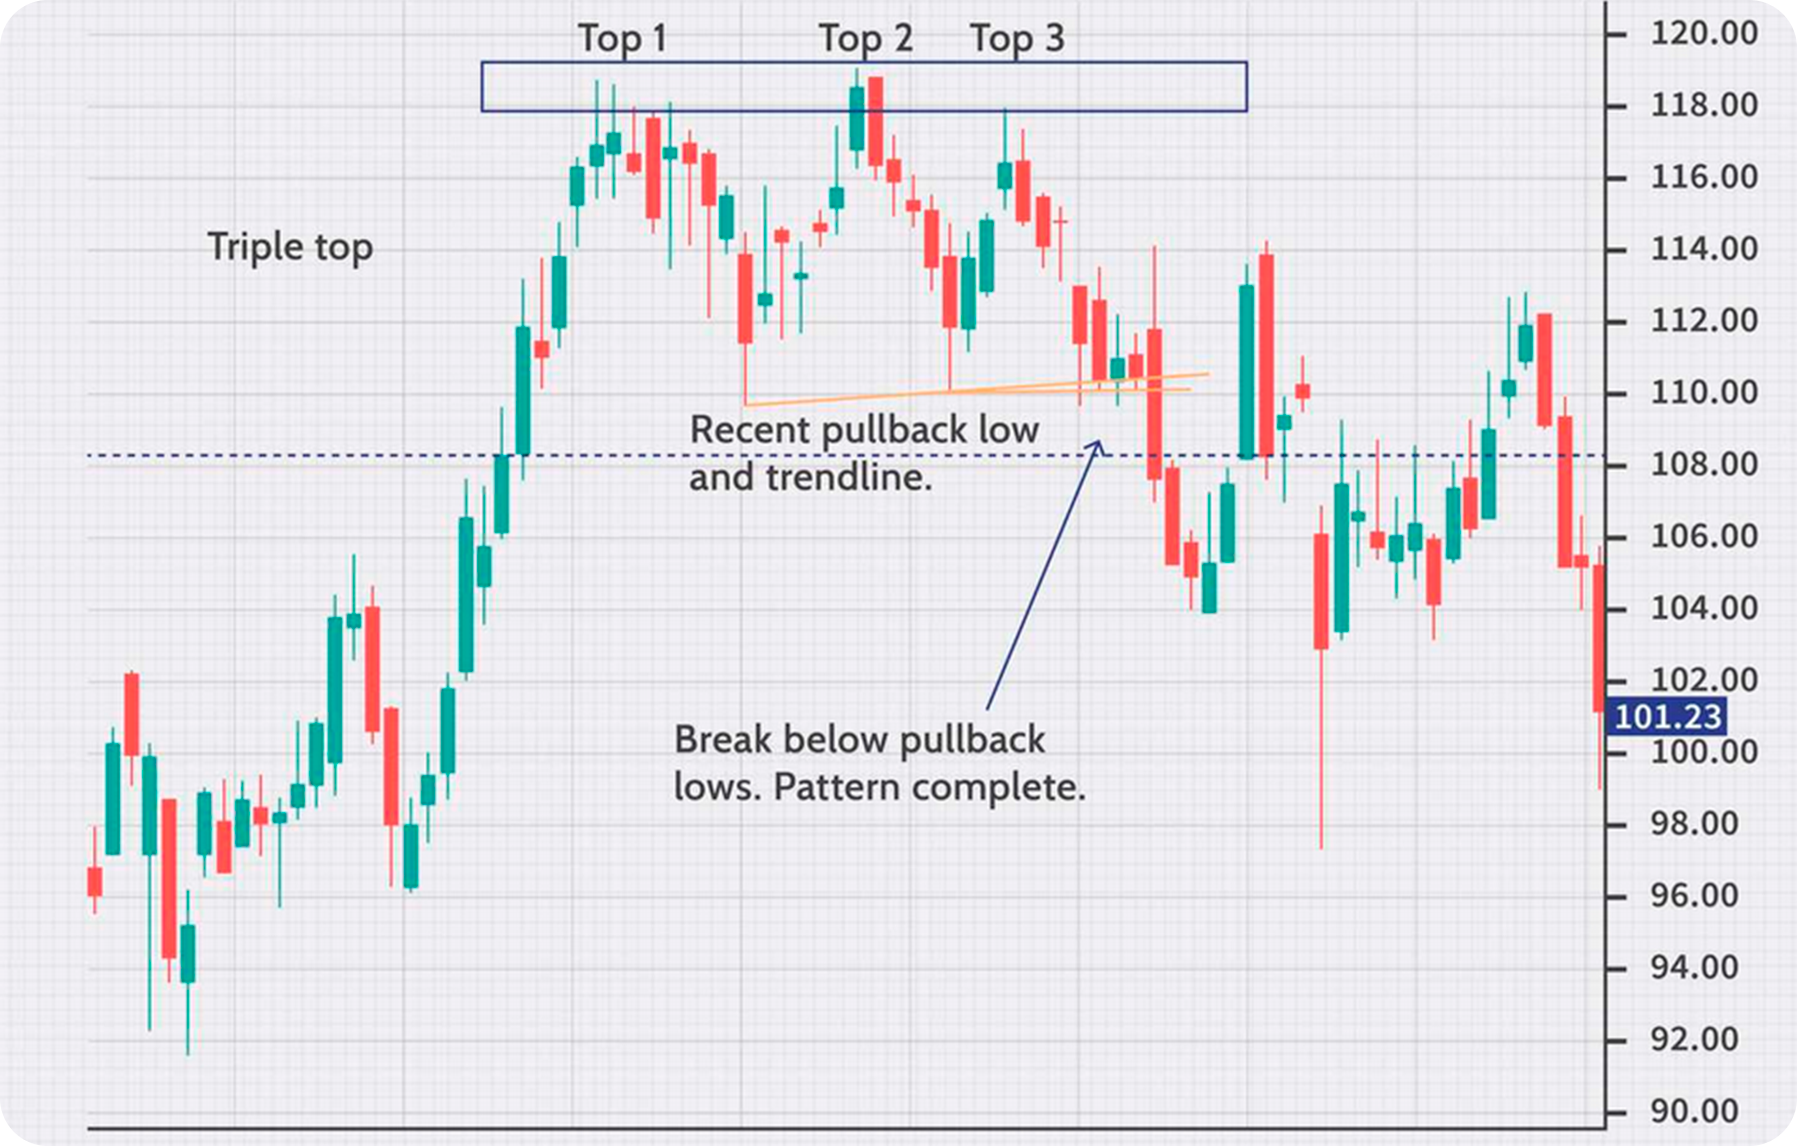
- Triple Tops
Triple Tops on a crypto chart signify strong resistance, suggesting a further robust reversal.
- Flags
Flags are brief pauses in crypto trends where prices consolidate in a tight range before continuing the prior move. They indicate temporary market indecision before the trend resumes. It is important to look into the flags pattern when trading crypto.
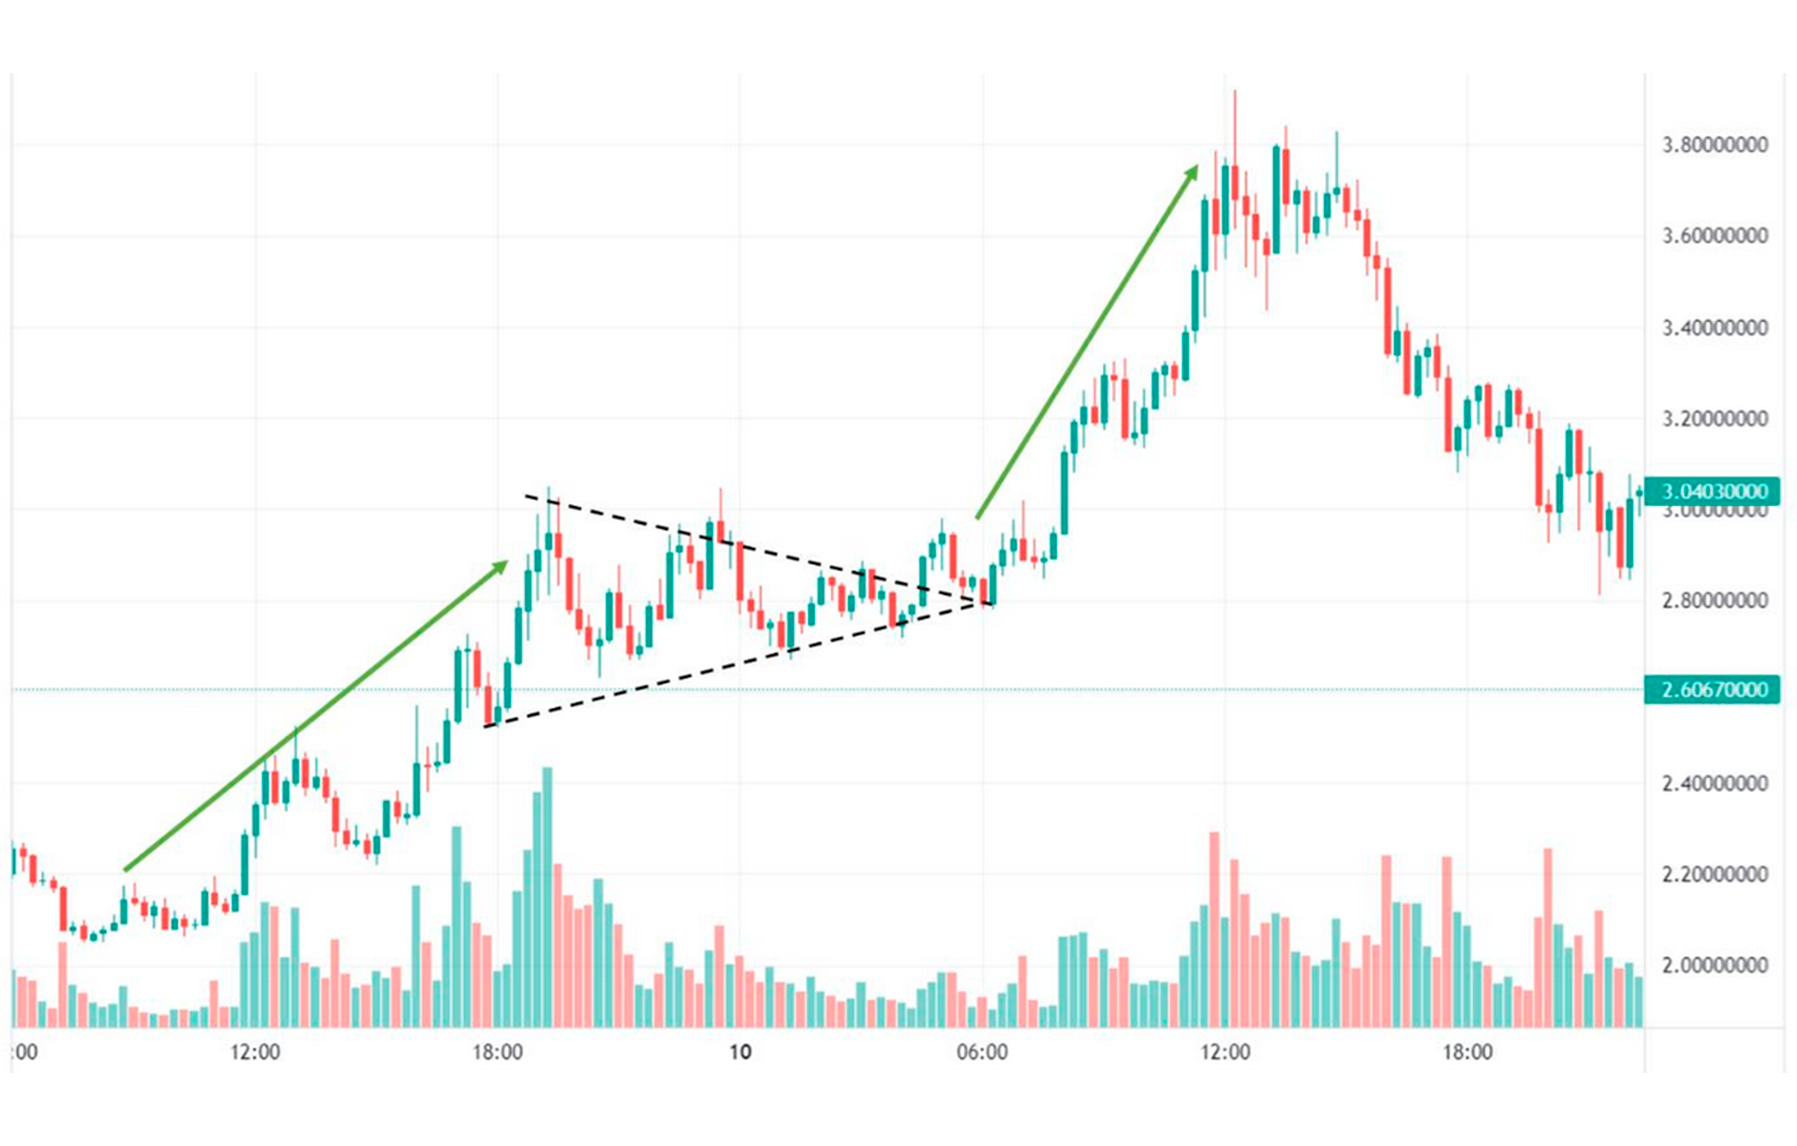
- Pennants
Pennants are similar to flags, but they form a small symmetrical triangle, narrowing to a point. They signal a temporary pause before the prevailing trend continues.
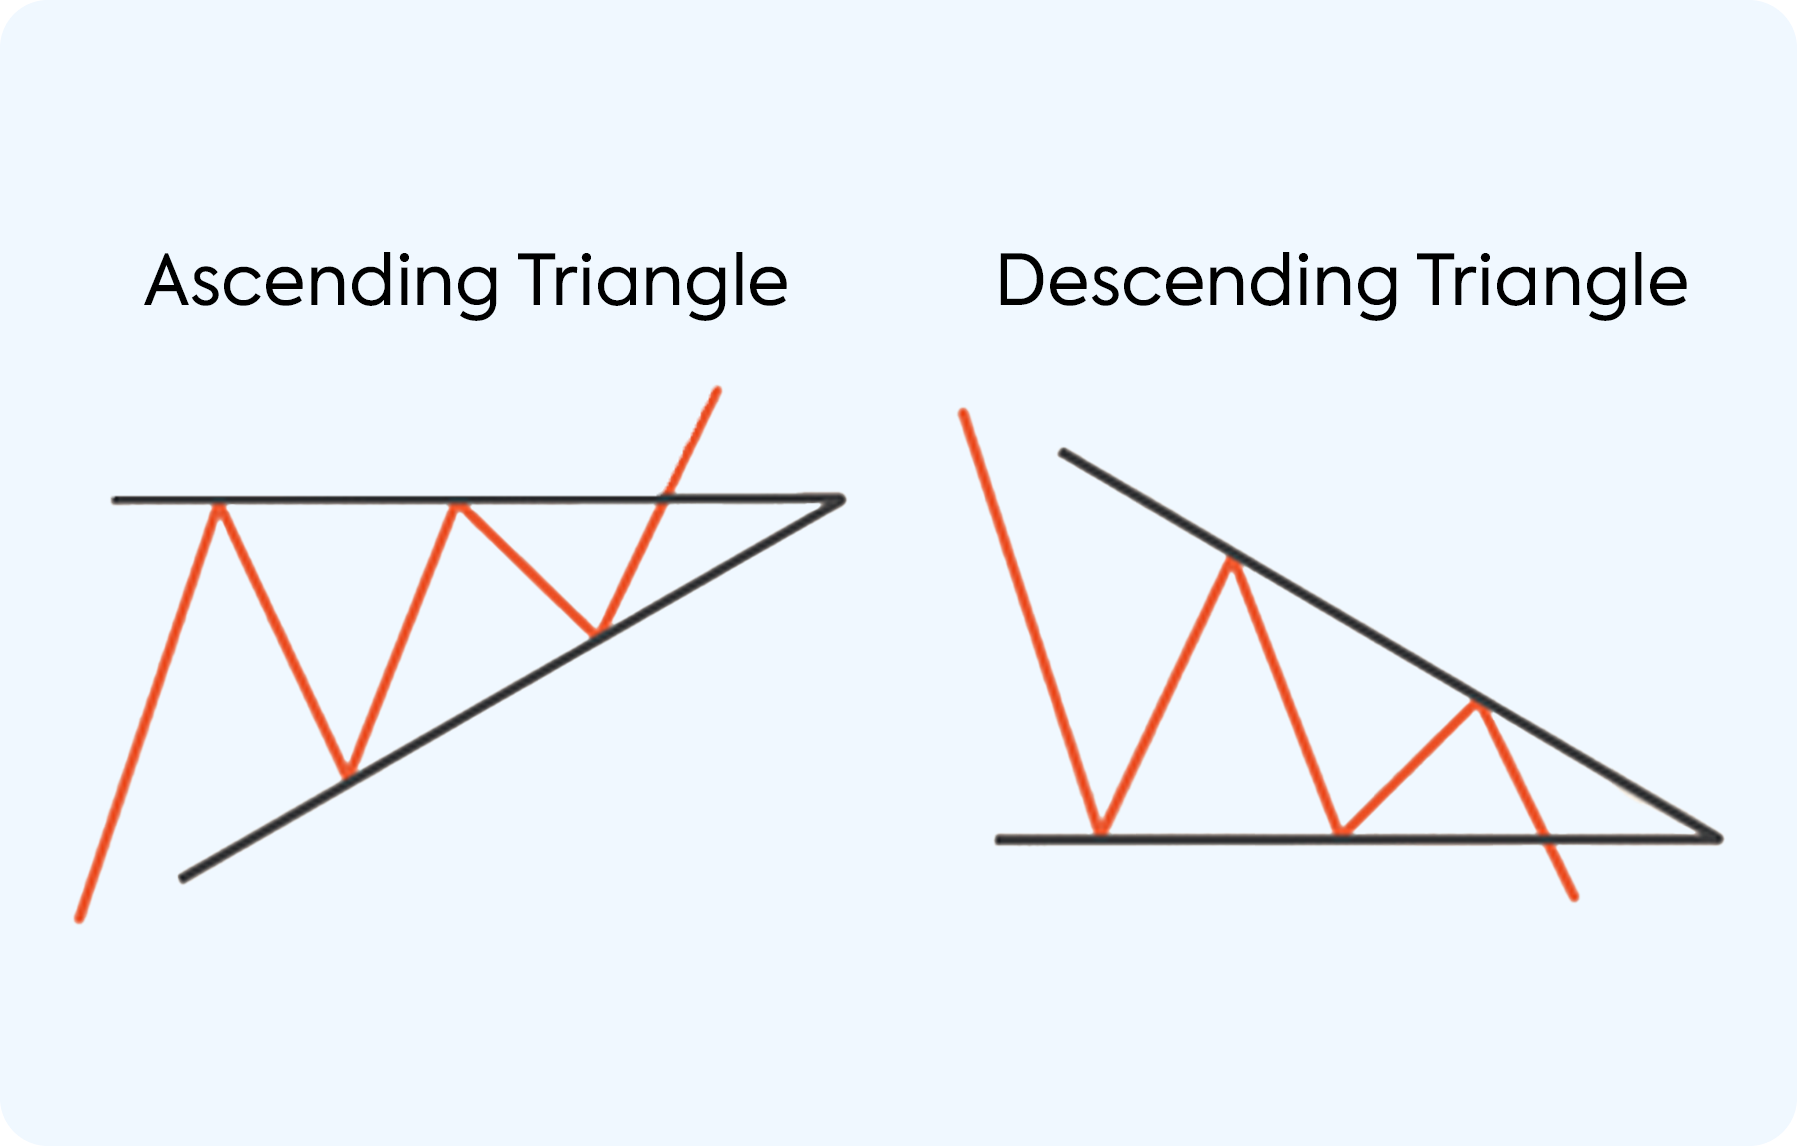
- Ascending/Descending Triangles
Ascending/Descending Triangles illustrate a tightening trading range, indicating an eventual breakout in the direction of the prevailing trend.
Identifying crypto chart patterns provides insights into likely future price moves. Traders often combine patterns with indicators to time entries.
Cryptocurrency Trading: Indicators & Oscillators
Below are the most broadly used tools that help analyze crypto charts.
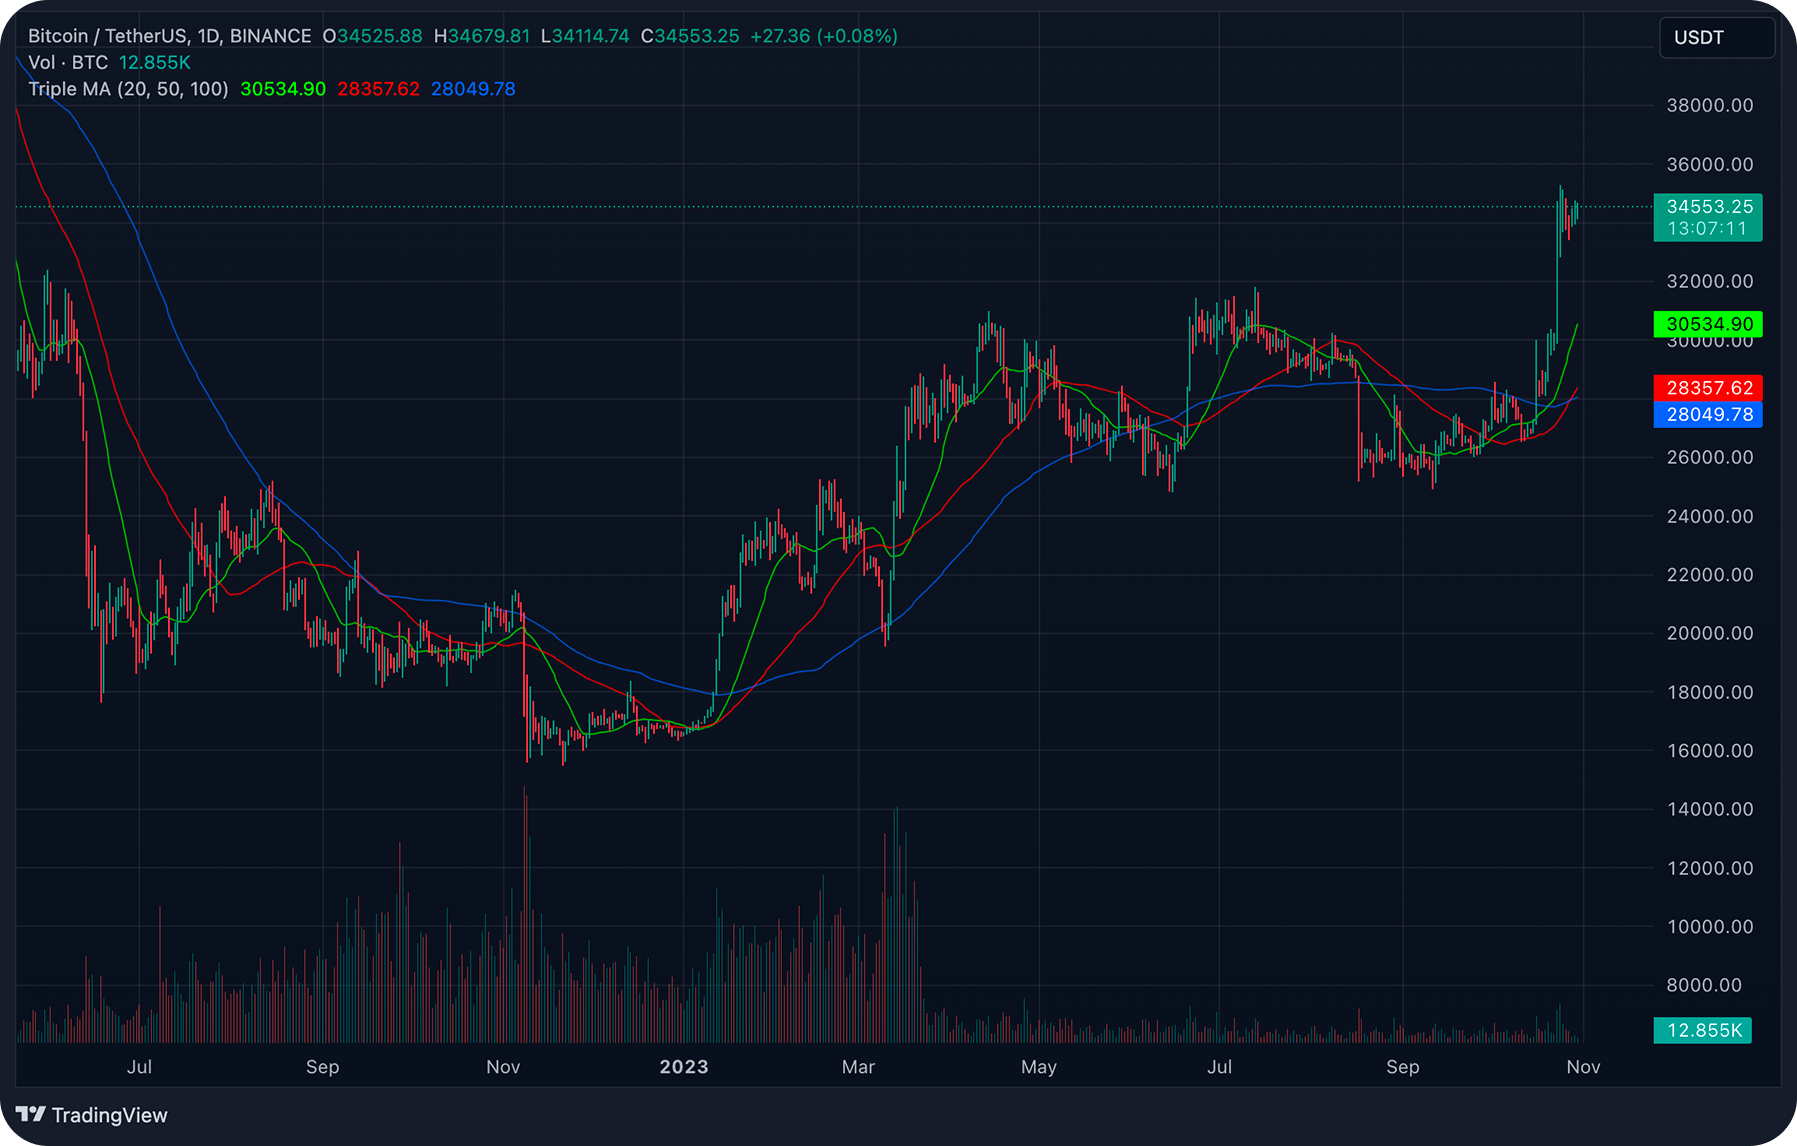
- Moving Averages
Moving Averages track the average price over a specified period, smoothing out price fluctuations. Such crossovers, when short-term averages cross above or below long-term averages, signal a possible change in crypto trends. Look out for them while trading crypto.
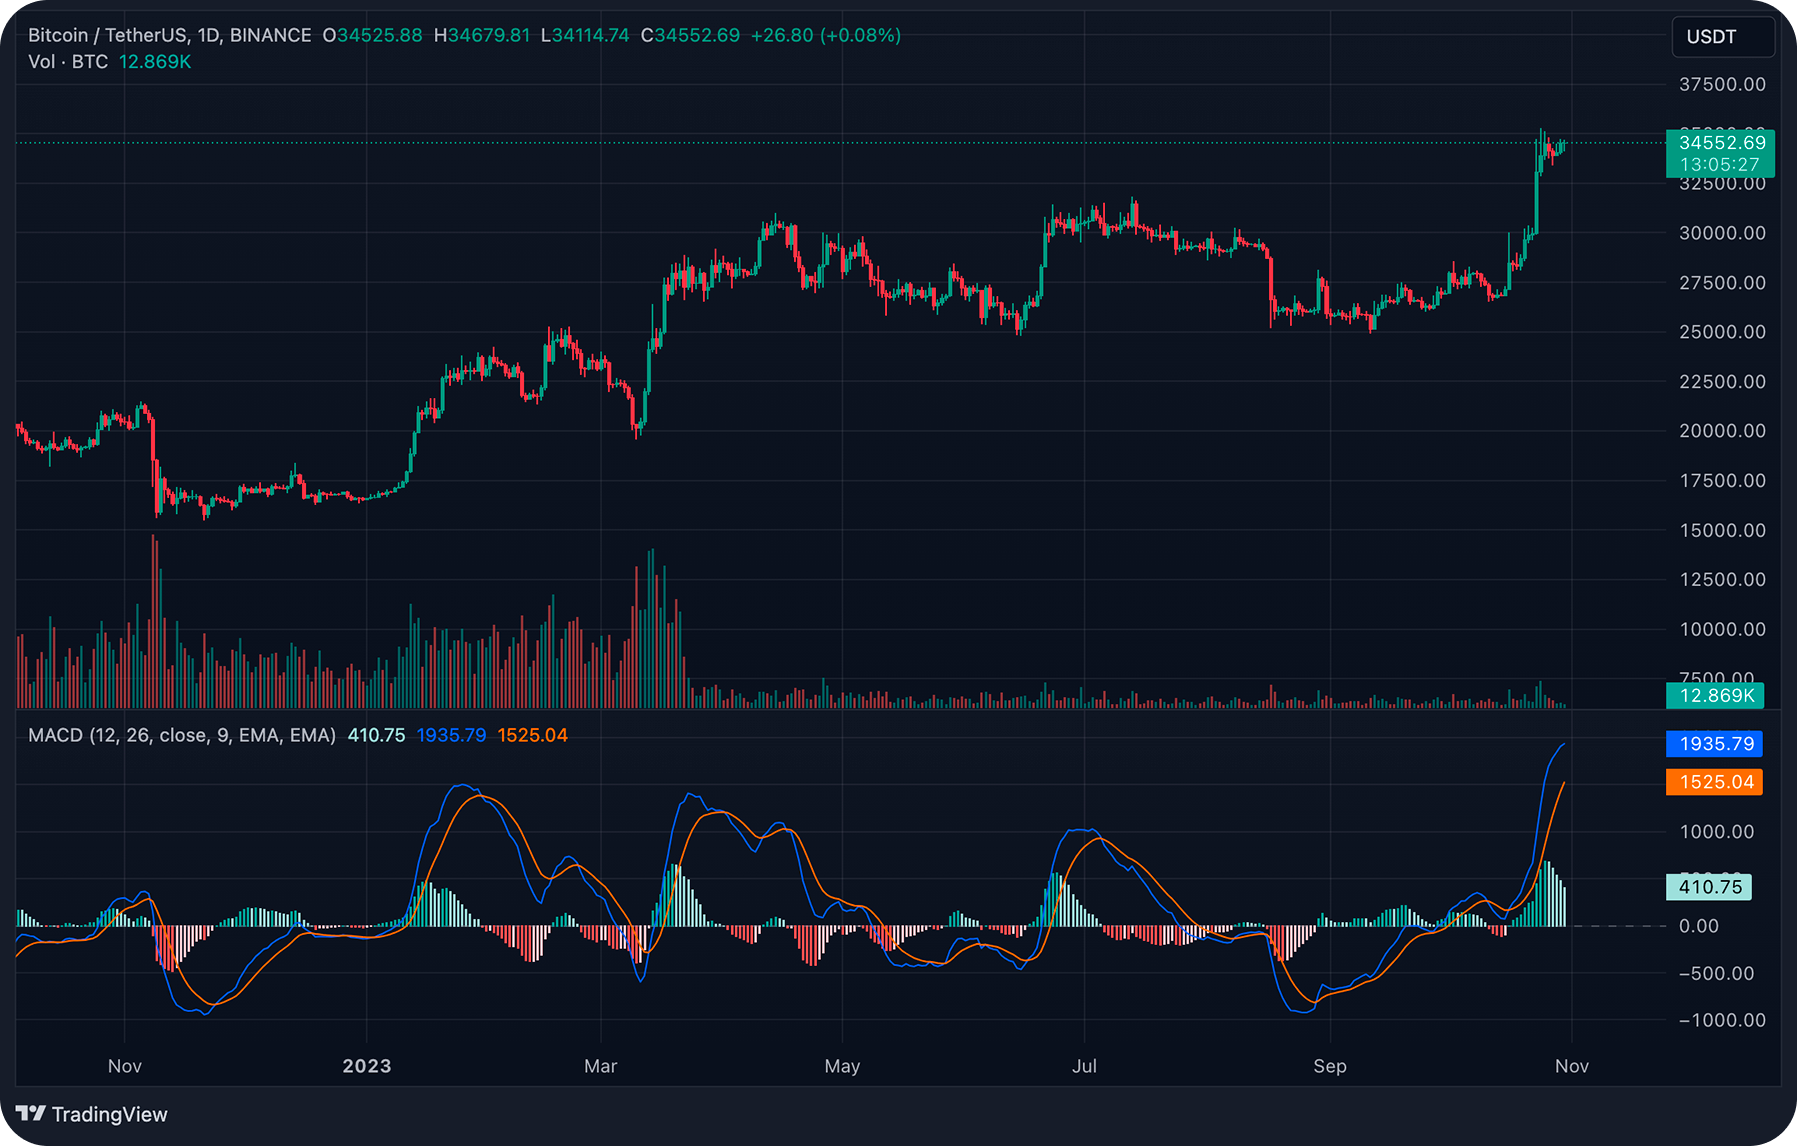
- MACD (Moving Average Convergence Divergence)
MACD compares short and long-term moving averages to identify momentum shifts in a trend. MACD crossovers offer powerful buy or sell signals.
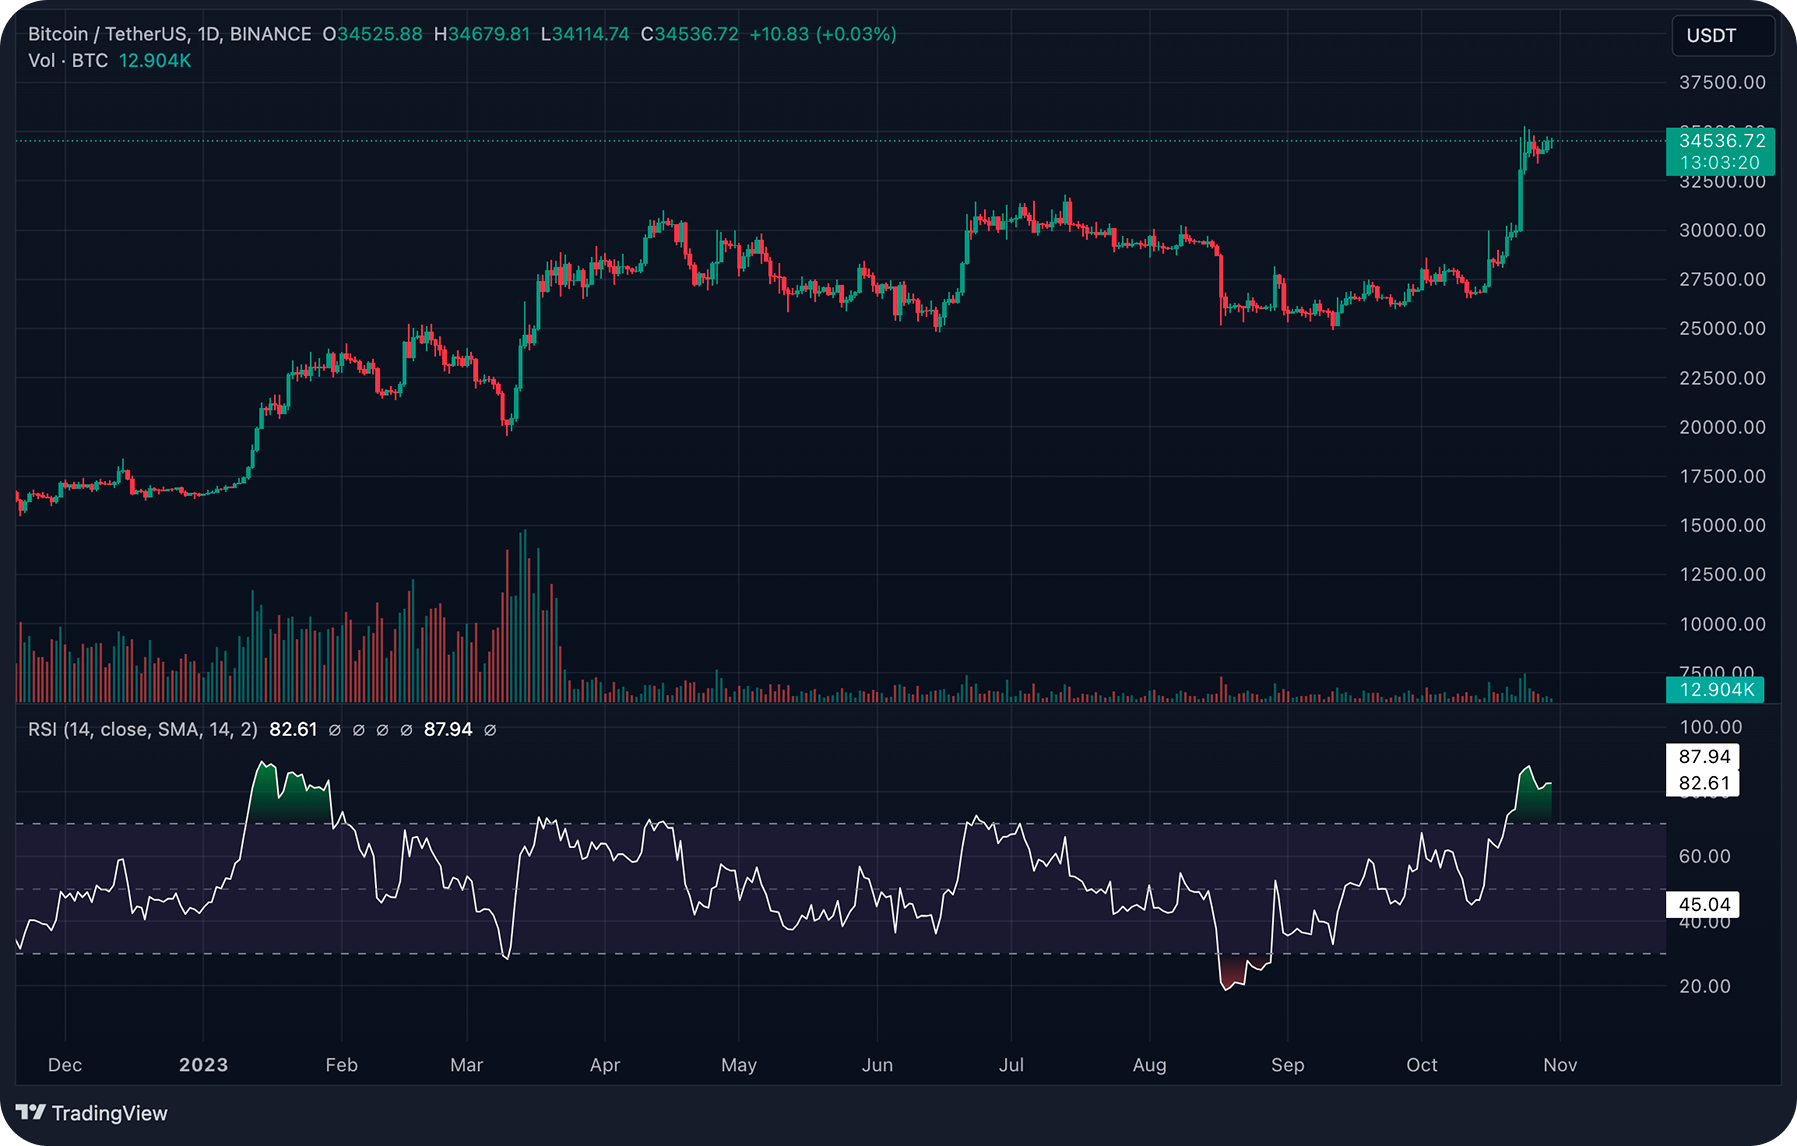
- RSI (Relative Strength Index)
RSI indicates overbought (>70) or oversold (<30) conditions. Overbought conditions suggest potential tops, while oversold conditions indicate potential bottoms.
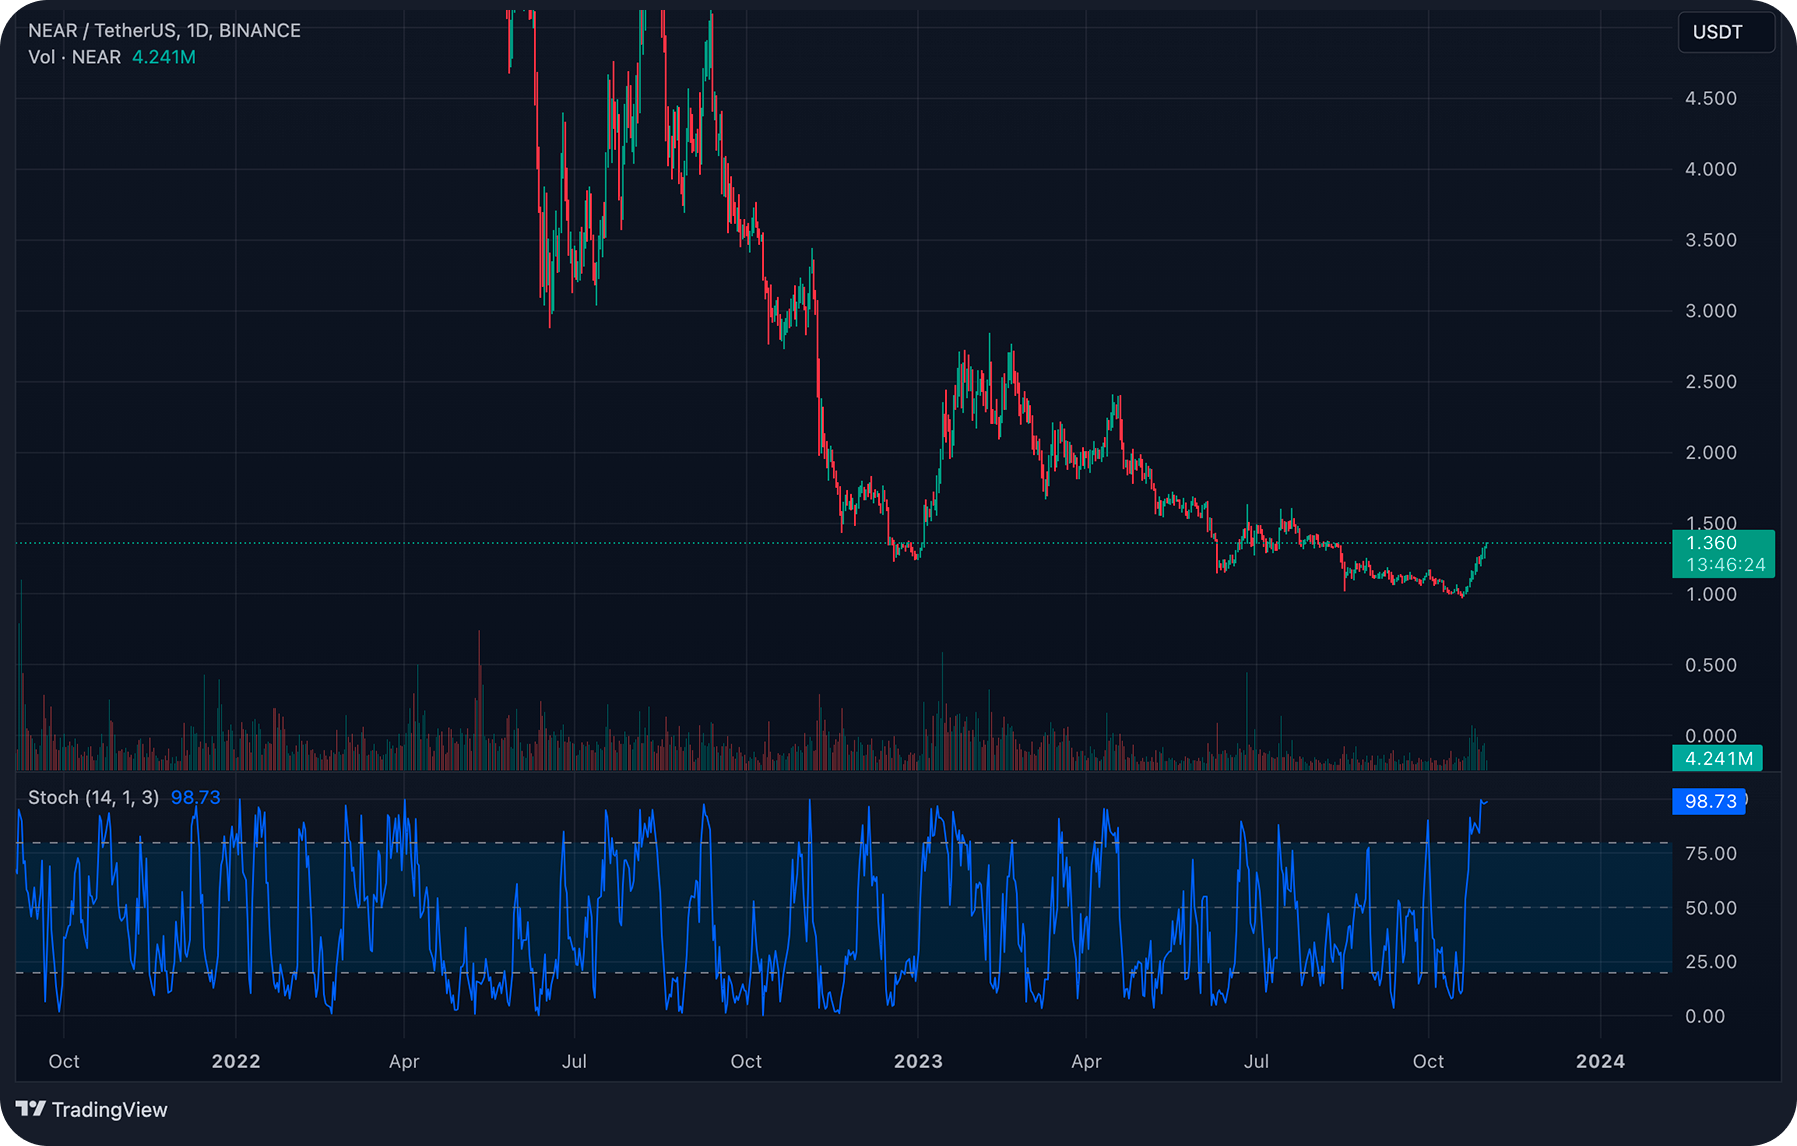
- Stochastics
Stochastics assesses if prices have been driven too high or too low relative to recent price action. It helps identify potential reversals of crypto trends when researching options of crypto trading.
Indicators smooth out price action and can identify subtle shifts or divergences. Traders often use multiple indicators together to confirm signals.
Crypto Trading: Volume Indicator
Trading volumes show the number of deals and their sizes made with assets over a selected period of time. It is one of the important factors for qualitative analysis for cryptocurrency trading.
High trading volumes indicate the interest of market participants, confirm the current direction of price movement, and speak to the high liquidity of cryptocurrency.
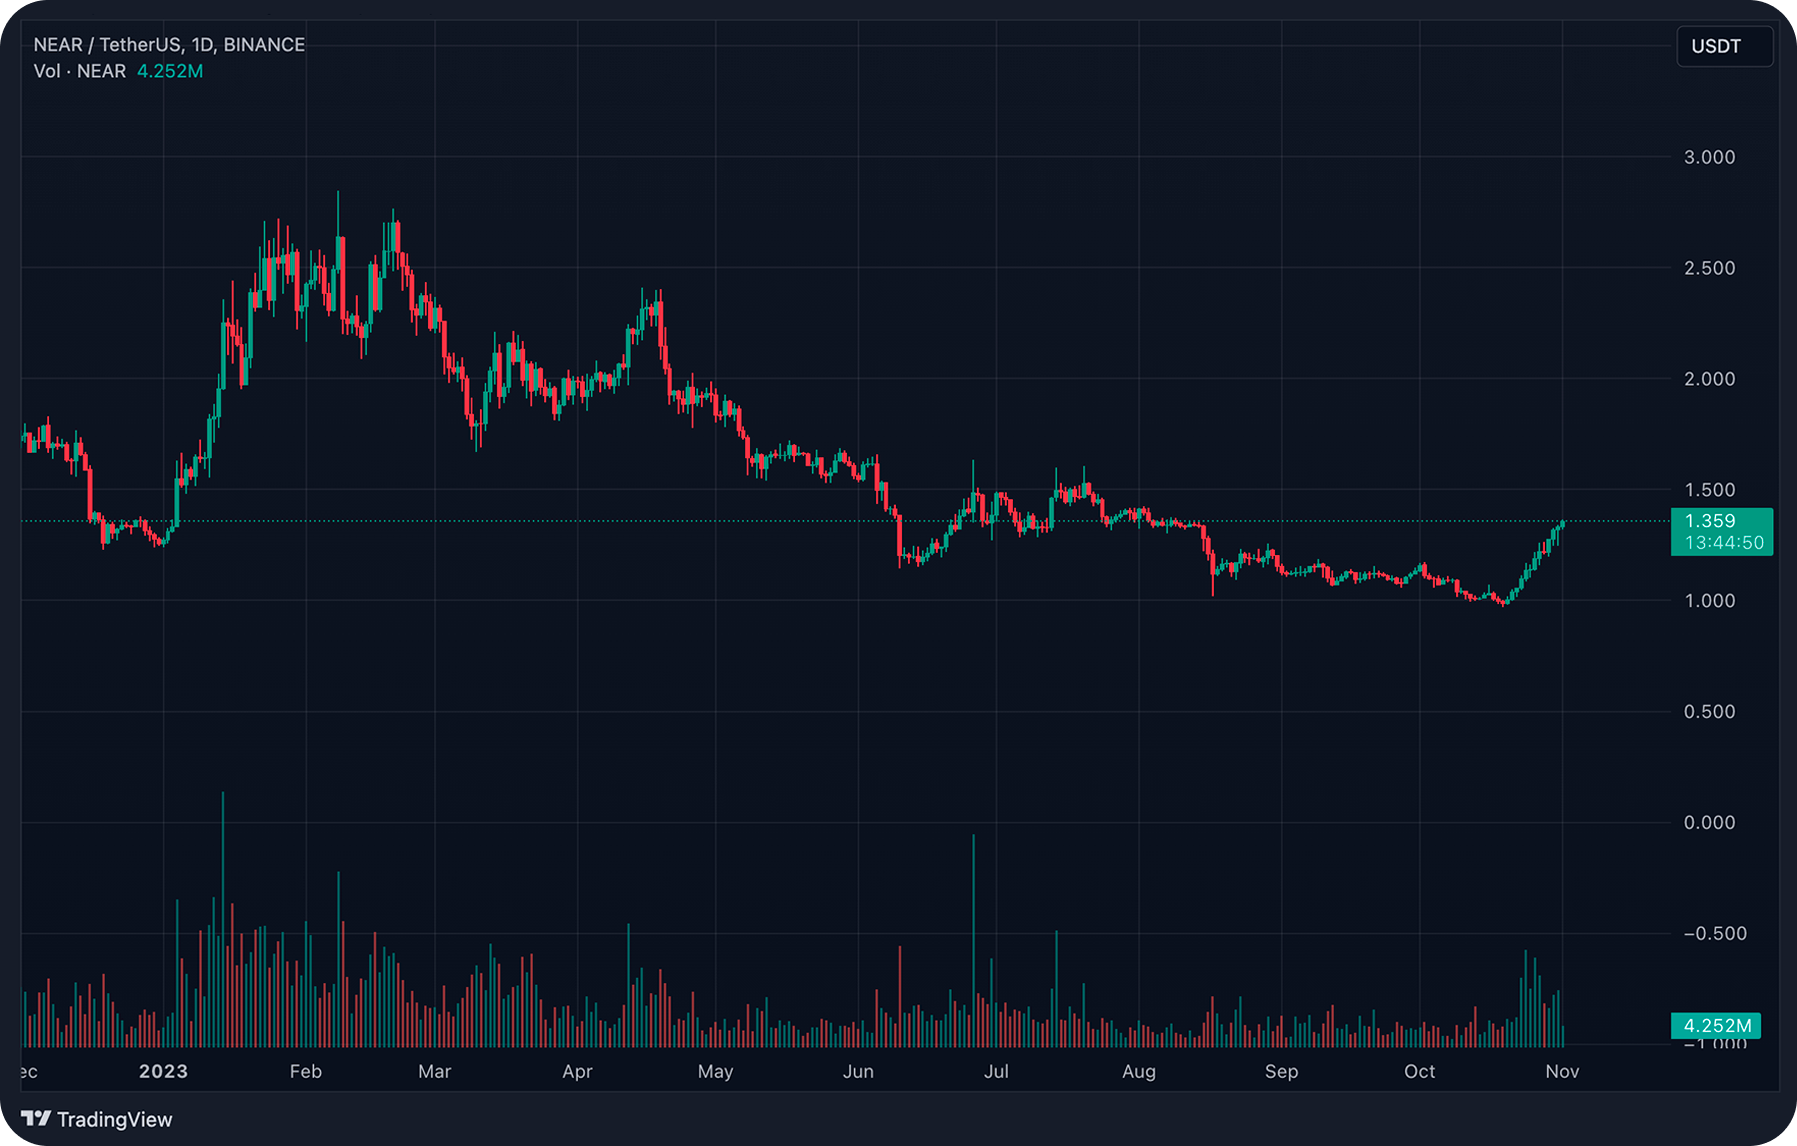
Trading volumes are shown by a histogram with vertical bars and are displayed at the bottom of the crypto chart. Each candle on the crypto chart patterns corresponds to a column. The height of the column shows the trading volume for the selected time period.
The color of a column on crypto charts indicates the direction of an asset's price movement — buying or selling. A green-colored column means that there were more purchases during this period, while a red-colored column means that there were more sales.
- High volume
High volume confirms the durability of a price move, while low volume suggests weaker commitment.
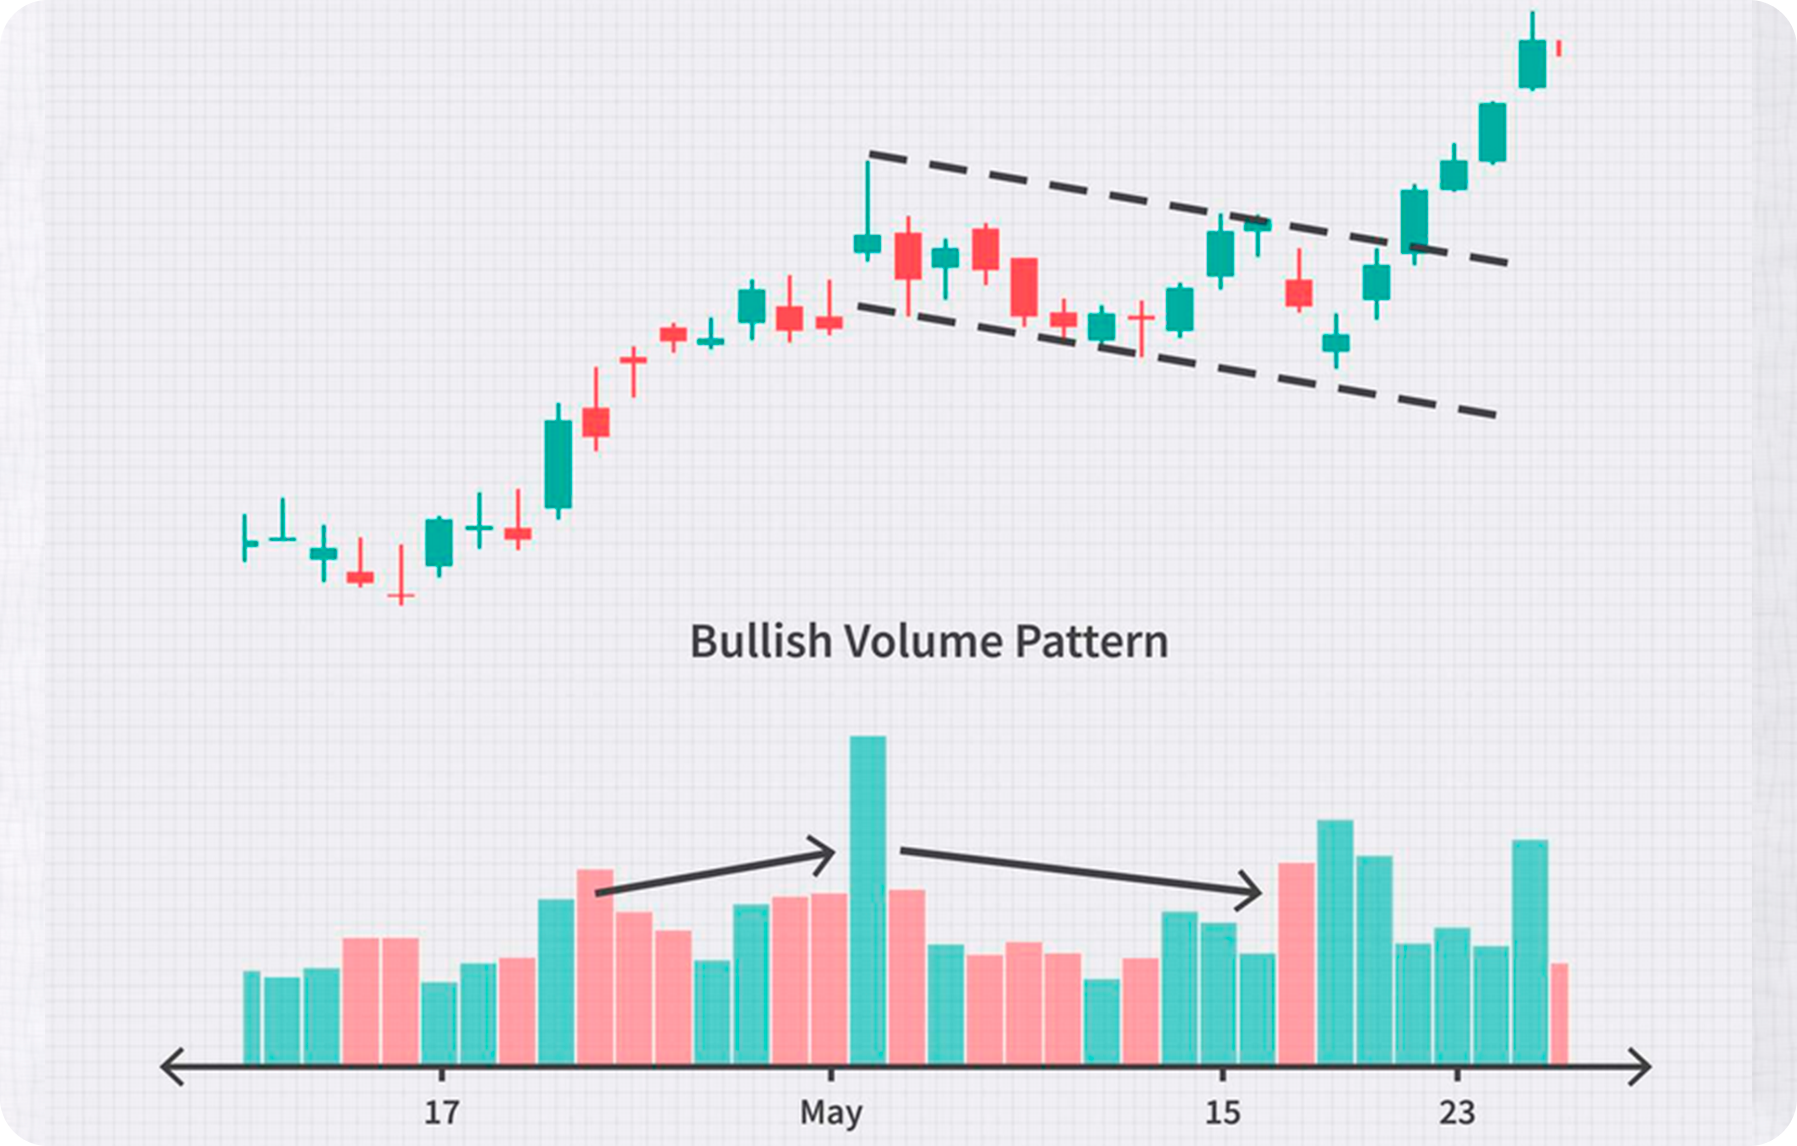
- Increasing volume
Technicalities of crypto charts require studying volume. An increase in volume generally precedes price rises, while decreasing volume precedes price drops.
- Spikes in volume
Volume spikes can signal trend reversals or breakouts. Analysis of crypto charts utilizes volume to determine when major players are entering or exiting positions.
Combining price and volume crypto value analysis provides a more complete picture.
How to Trade with Crypto Charts
Traders rely on chart analysis to shape their cryptocurrency trading strategies:
- Trend trading
Spot the overall trend and trade in line with it. Buy in uptrends, sell in downtrends.
- Support/resistance strategy
Identify support/resistance zones to set entry and stop-loss levels.
- Timed entry tactics
Time entries on pullbacks or at pattern breakouts.
- Targeted exits approach
Set target exit points based on potential resistance ahead.
Letting the crypto chart guide your actions improves trading outcomes.
Users can buy cryptocurrencies for fiat or crypto on SimpleSwap.
Summary
By studying price crypto charts, patterns, indicators and volume, traders can identify high-probability crypto trading opportunities. The key is combining different analytical techniques to validate signals and gain conviction.
Mastering these tools allows traders to determine the market’s prevailing trend across timeframes. Armed with the knowledge of technical crypto analysis, users can spot deals aligned with the major trend.
Using the techniques described in this article provides valuable insights into market psychology and price direction. All of that blows for a successful cryptocurrency trading.
The information in this article is not a piece of financial advice or any other advice of any kind. The reader should be aware of the risks involved in trading cryptocurrencies and make their own informed decisions. SimpleSwap is not responsible for any losses incurred due to such risks. For details, please see our Terms of Service.


