TRX Technical Analysis 2024
Key Insights
- TRX has shown a strong uptrend since late 2022, trading at $0.1613 and aiming to break its 2021 ATH of $0.18.
- Recent increased trading volumes, driven by new investors and Justin Sun's platform launch, have bolstered TRX's price momentum.
- Three scenarios are outlined: continued growth to $0.2150, a short-term dip to $0.1480 followed by recovery, and a deeper correction to $0.1350 before a rebound.
As of this writing, TRX ranks 10th on CoinMarketCap with a market cap of $14,001,075,041 and a 24-hour trading volume of $484,033,390.
Over the past week, it has consistently been in the top 10 by trading volume.
TRX Technical Analysis
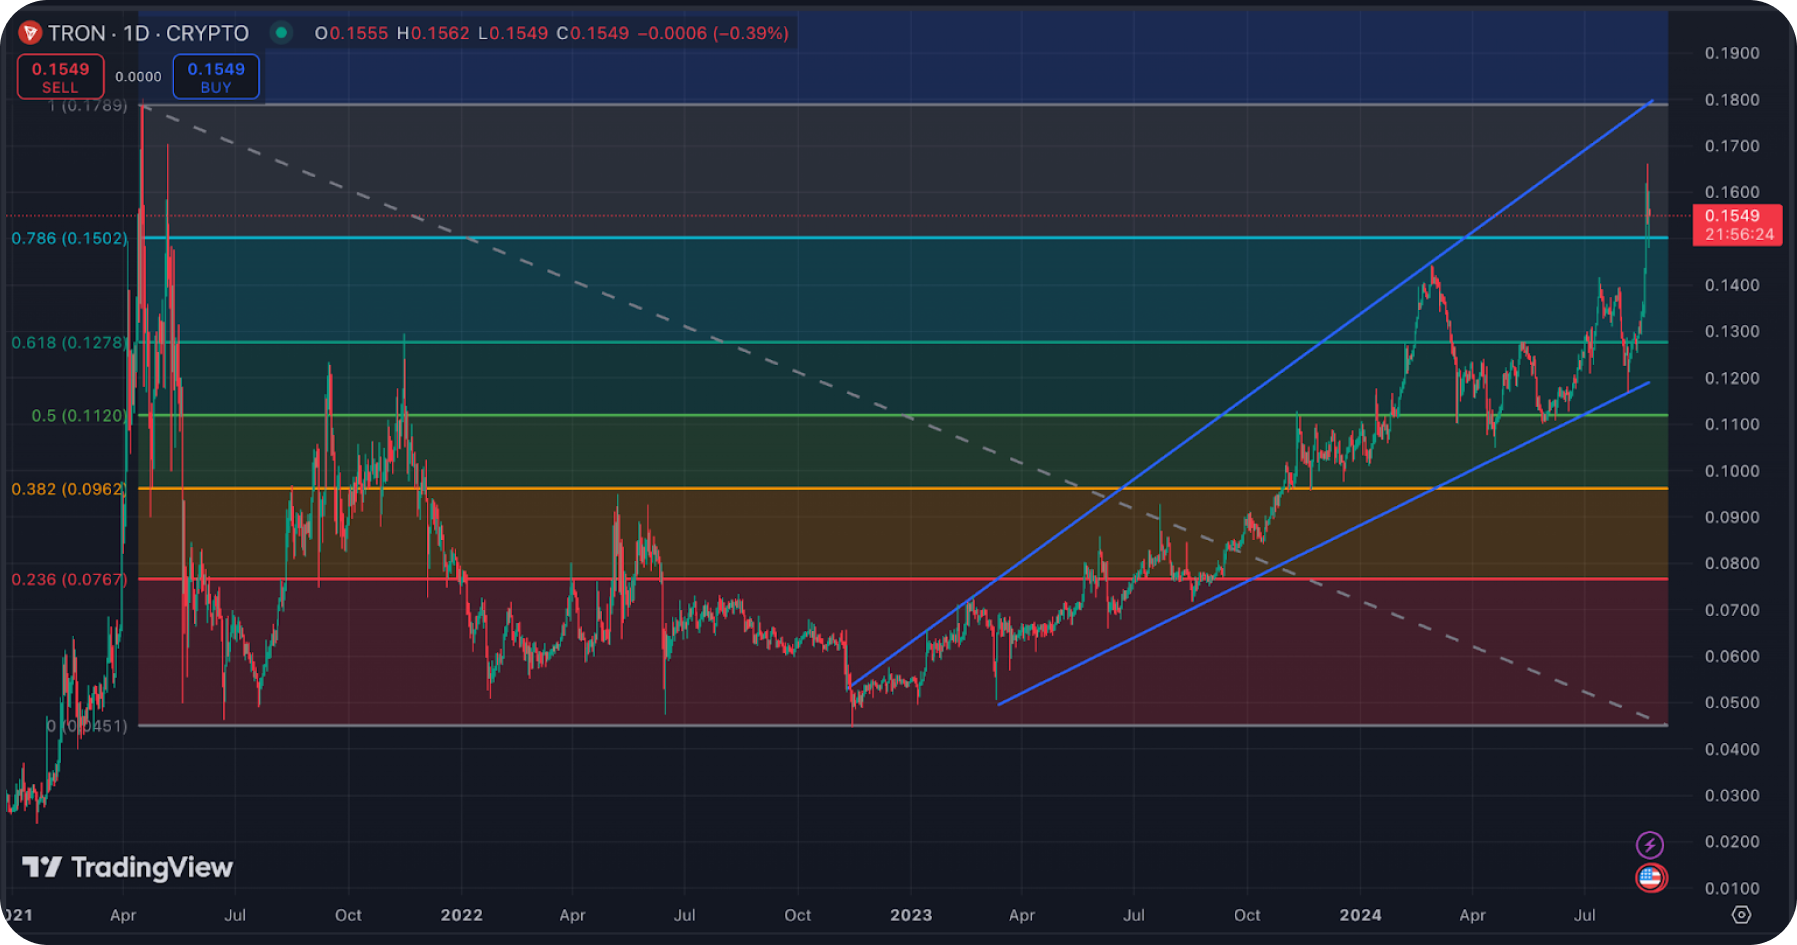
The chart provided below shows the TRON daily performance since mid-2021.

Starting from mid-2021, after reaching its all-time high around $0.18, Tron underwent a correction, finding its bottom at $0.0459.
Following this, the asset entered a period of accumulation, characterized by medium-term cycles of growth and decline. During this time, it made several false breakouts above the crucial level of $0.1120 (0.5 on the Fibonacci retracement) before dropping back to its minimum.
Since the end of 2022 and into early 2023, TRX shifted to an upward trend, successfully breaking above and holding key resistance levels at $0.0961 and $0.1120. It formed a broad ascending channel within the range of $0.12 to $0.18. After testing the upward-sloping support line of $0.1120 (now a support at 0.5 on Fibonacci) several times, the price is currently trading at $0.1613.
Over the past week, TRX has shown increased volumes ($500 million to $2 billion daily) due to an influx of new investors into the market, driven by Justin Sun's launch of the platform sunpump.meme.
TRX Price Prediction
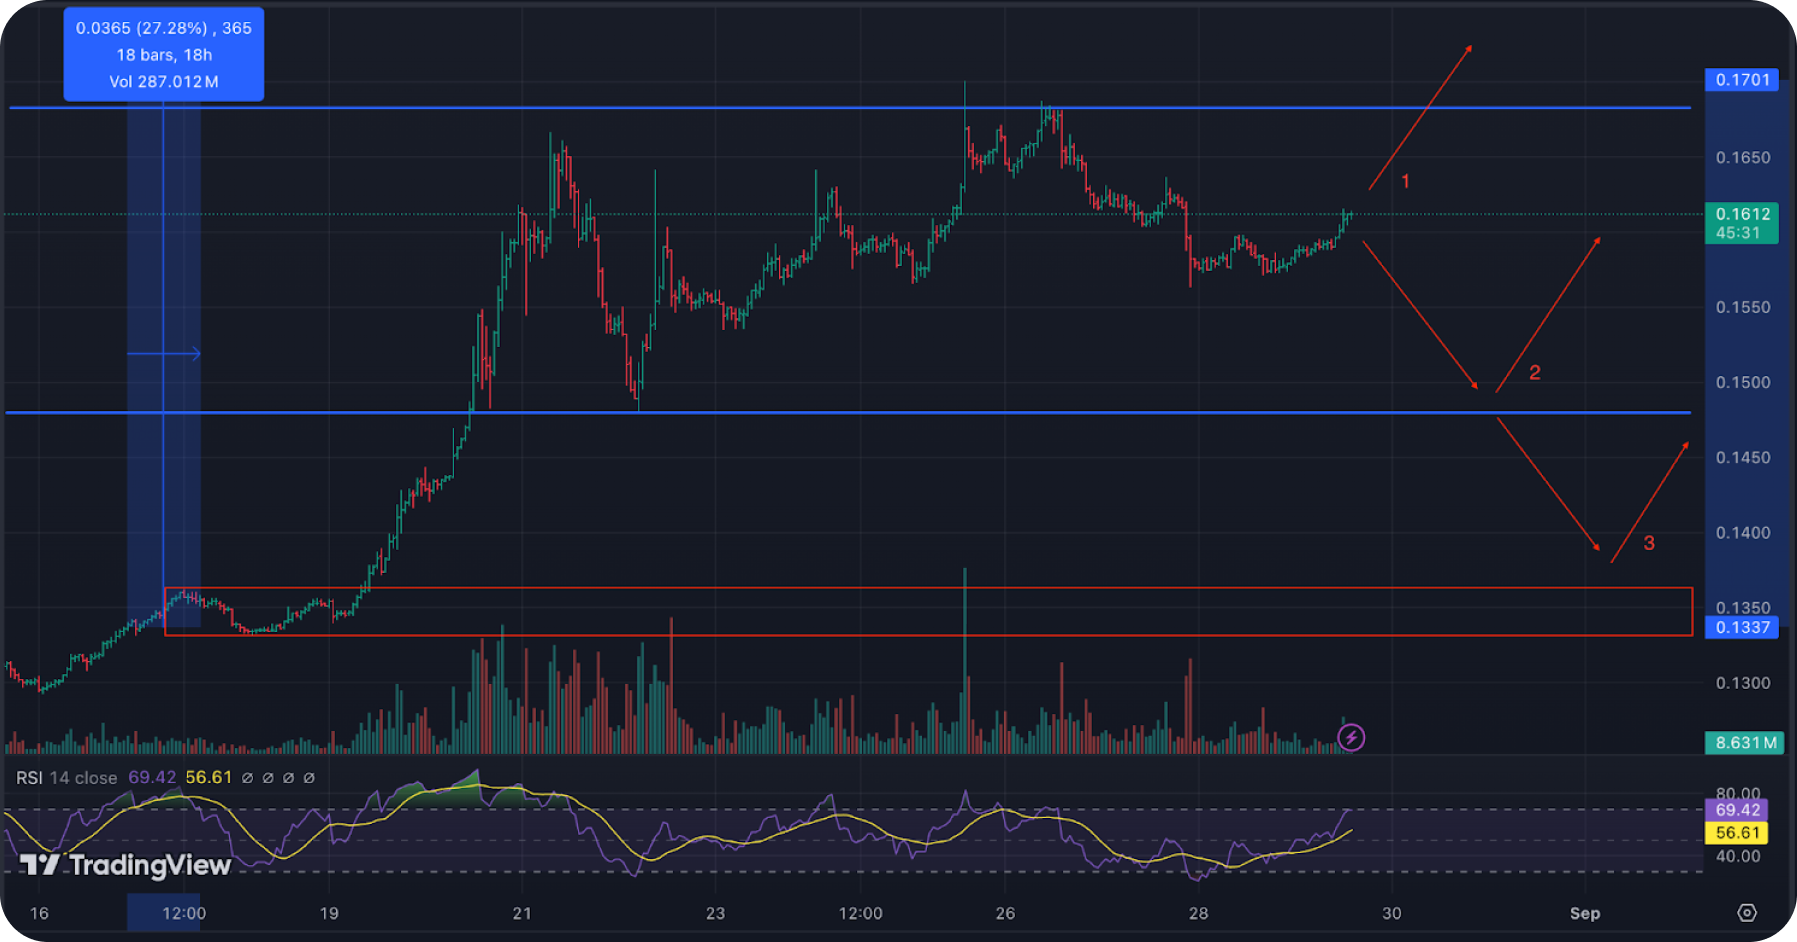
Having shown a weekly price increase of over 20%, Tron is trading around $0.1613. With a strong uptrend, increasing volumes, and the breakout of important resistance levels, TRX is likely to aim for breaking its 2021 ATH of $0.18 in the coming month.
Currently, the first scenario (please see all 3 scenarios marked on the chart) suggests growth from current levels, aiming for $0.1750, followed by testing this level and breaking the ATH, with a maximum impulse potentially reaching $0.2150.

The second short-term scenario is a drop to $0.1480, allowing overbought indicators from the past few days to cool off, forming a W pattern, and then rebounding towards the ATH ($0.18).
The third scenario involves a deeper correction to the $0.1350 level, with consolidation in this zone, followed by a move towards the ATH. In recent days, whale wallets (holding between $1 million and $10 million) have sold over $20 million worth of TRX. In the short term, a correction is possible, but in the medium term, growth towards the ATH is expected.
Users can get TRX on SimpleSwap.
The information in this article is not a piece of financial advice or any other advice of any kind. The reader should be aware of the risks involved in trading cryptocurrencies and make their own informed decisions. SimpleSwap is not responsible for any losses incurred due to such risks. For details, please see our Terms of Service.


