How to Read Crypto Charts: Basics of Graphical Analysis
Key Insights
- Cryptocurrency analysis, pioneered by Dow, reveals that prices contain all available information. Study of repeating price patterns and trends allows forecasting potential market moves.
- Candlestick charts are the most popular for traders today because they visually display important price action like the open, close, high and lowin an intuitive format. This makes interpreting sentiment and momentum easier.
- Analyzing multiple timeframes of charting crypto, from long-term to short-term, provides critical context on the overall trend as well as potential entry and exit points.
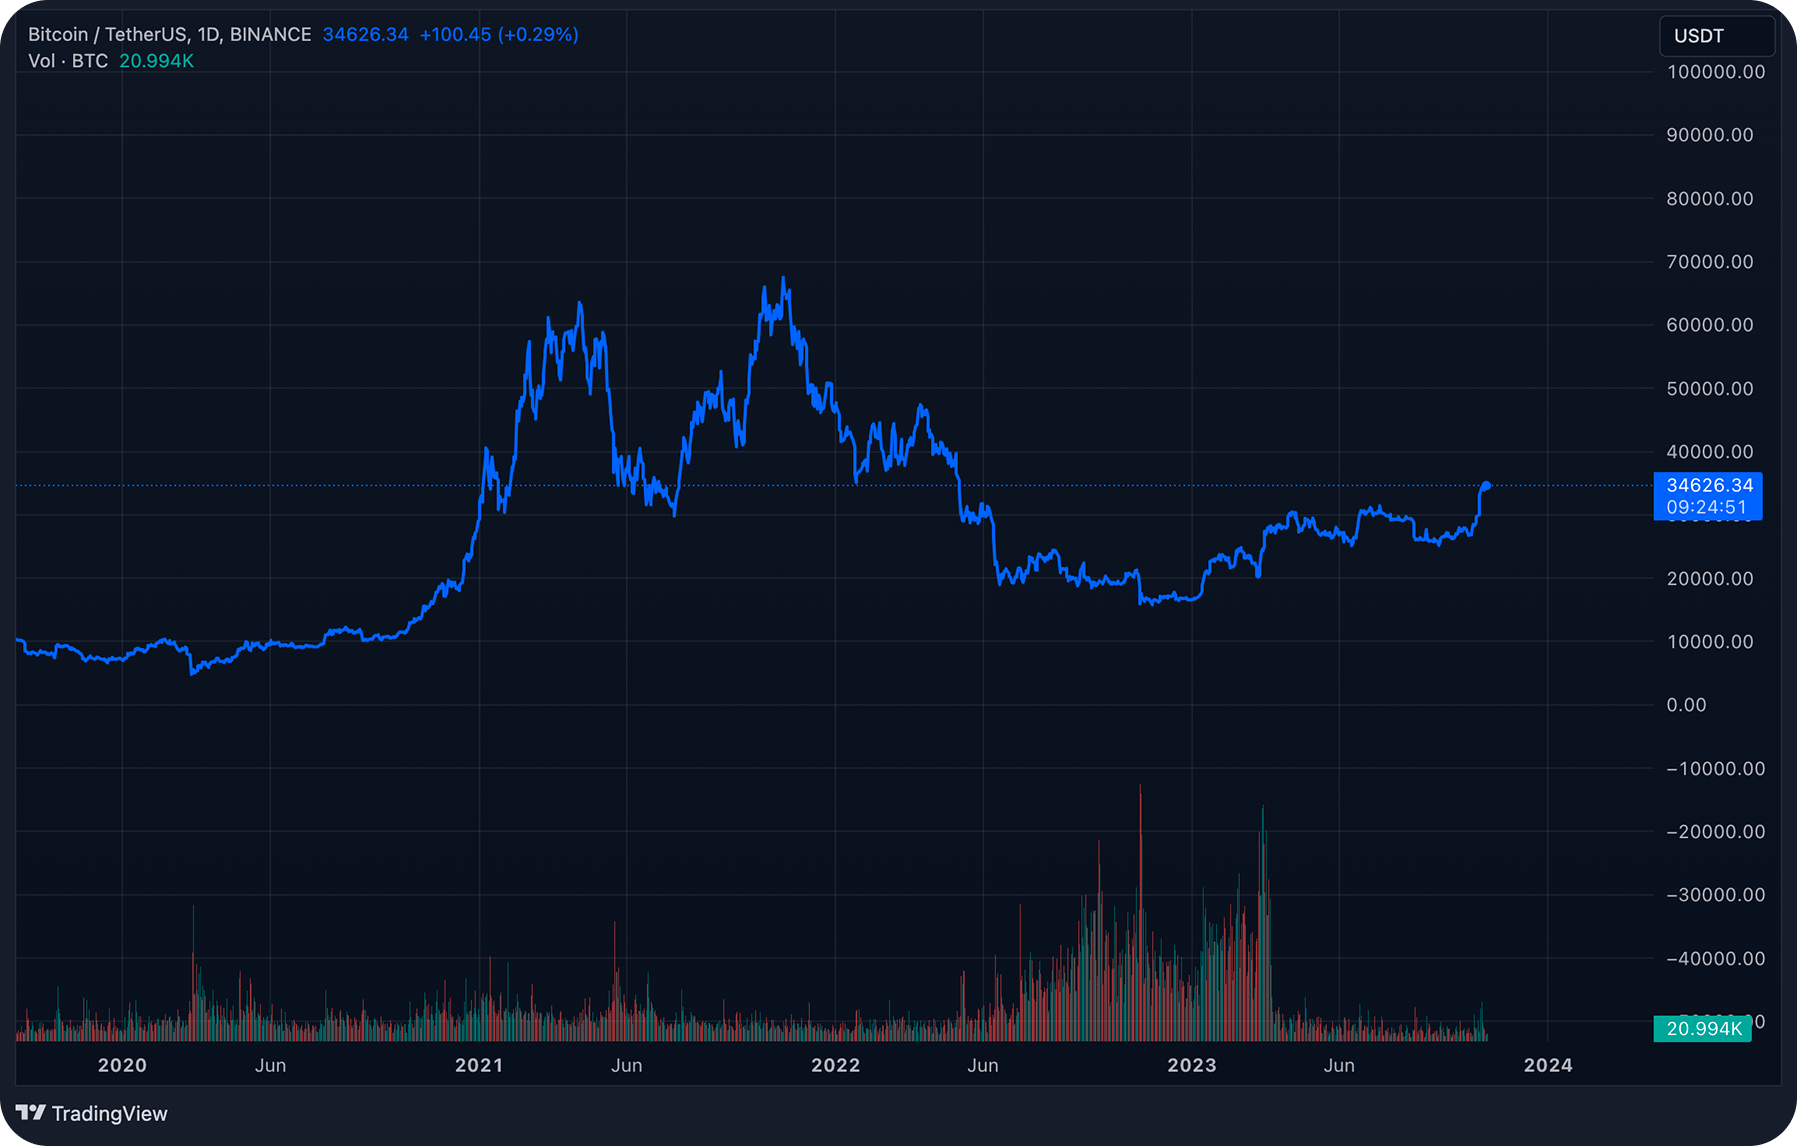
Crypto price charts are visual representations of asset prices over time. They plot the price movements in the form of a line, bar or candlestick to show how the price is changing. Charts allow traders and investors to see historical patterns, trends and important price levels at a glance.
Charles Dow identified repeatable crypto chart patterns and trends in the price action of stocks and developed Dow Theory in the late 19th century. He was an economist who founded the Wall Street Journal and creator of the Dow Jones Industrial Average.
The core principles of Dow Theory are:
- An asset’s price takes all factors into account
The current asset’s price (e.g. the price of Bitcoin) is determined by events that have occurred in the past, are occurring in the present, and are expected to occur in the future. The price reflects all currently available information affecting the supply and demand of that asset.
- History is always repeating itself
Market behavior is cyclical and, therefore, quite predictable. For example, news of a rate hike by the US Federal Reserve System in the past has consistently provoked Bitcoin sales.
- Price movements are always directional
Price movements clearly follow trends. If an uptrend or downtrend in the price of an asset has formed, it is likely that the price will continue to follow it, rather than moving in the opposite direction.
Types of Charts
How to read crypto charts? Start by seeing three main types of best crypto charts used for market analysis.
- Line Charts
Line charts connect closing prices with a line, showing the general price movement over time. Line charting crypto compactly show the overall trend direction but lack detail on the price range during the chosen period.
- Bar Charts
Bar Charts display a vertical bar for the chosen time period. The top and bottom of the bar mark the high and low price reached. A small horizontal dash on the bar shows the opening price and the closing price for that time period. This is the best crypto chart if you want to get more detailed data about price movements.
- Japanese Candlestick
Candlestick charts are the most popular type of charting crypto. A candlestick on such a chart contains information about the change in the price of assets for a selected time interval (e.g., for 1 hour).
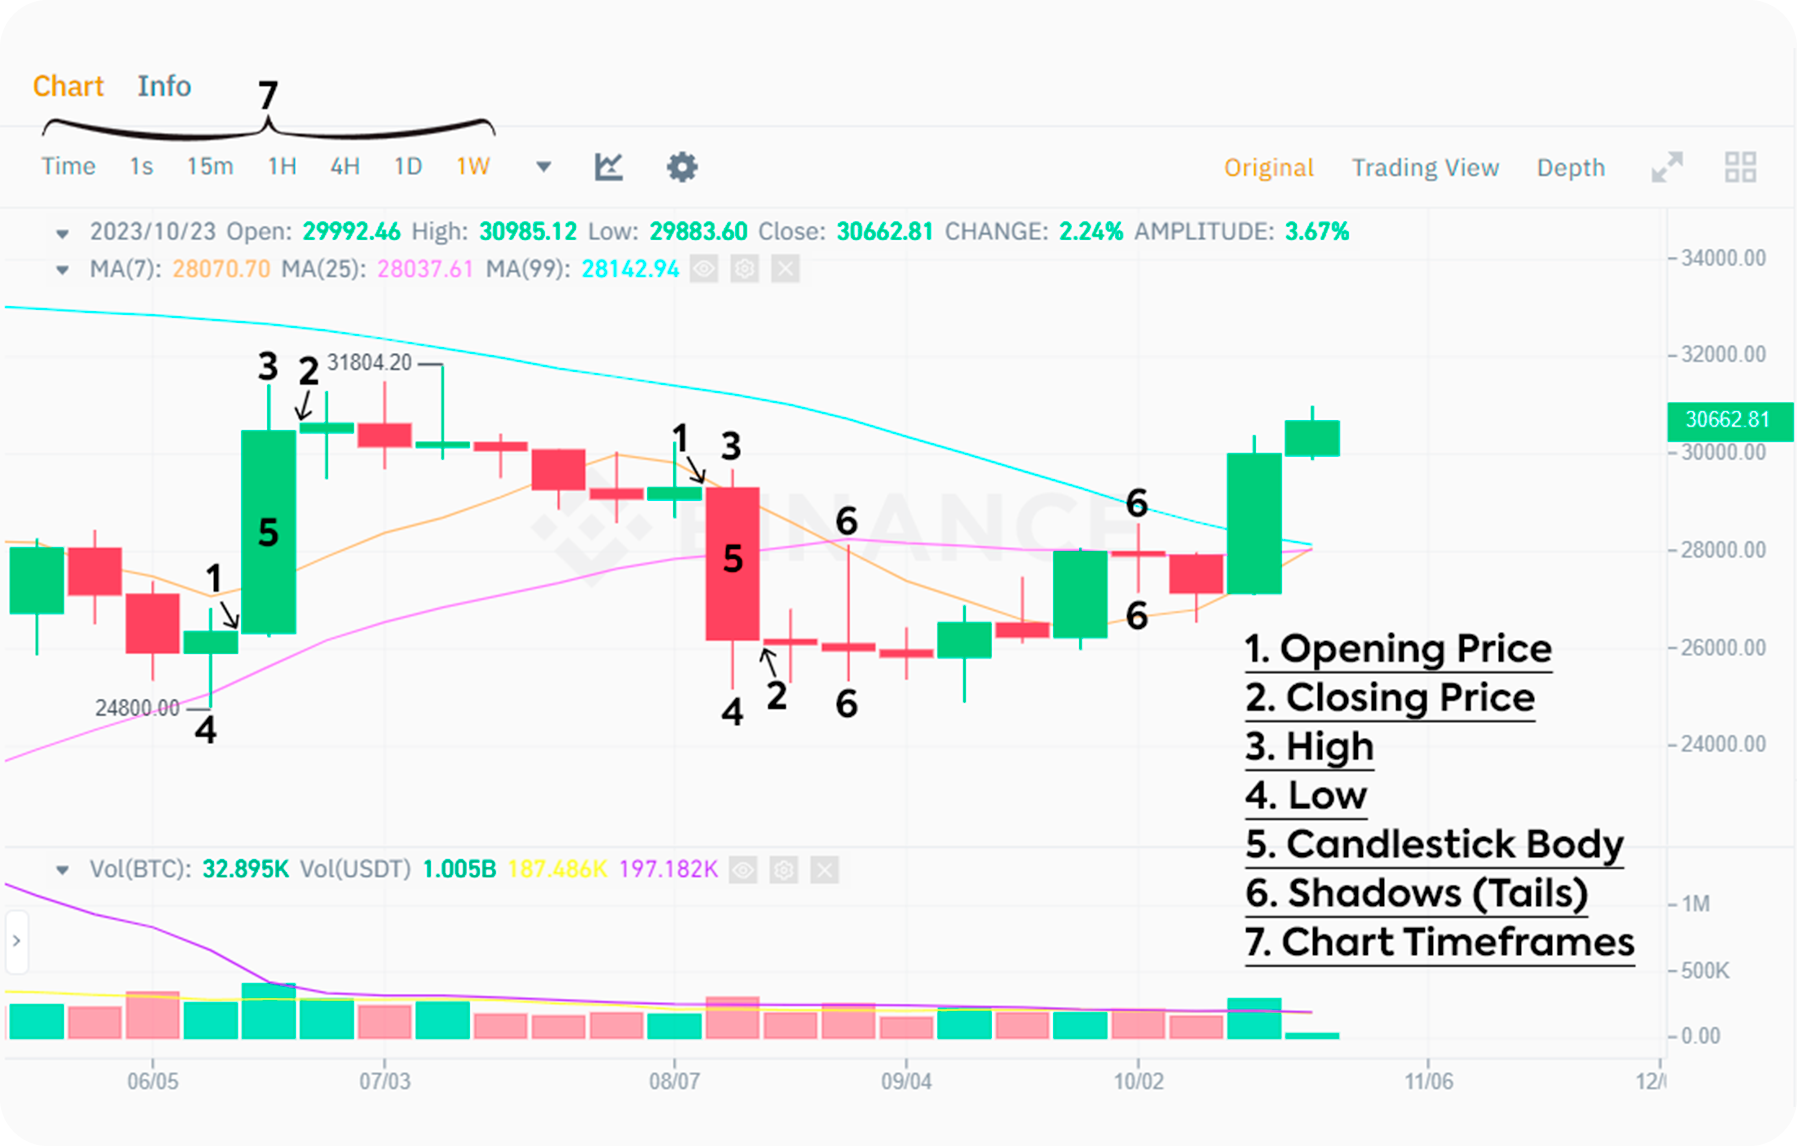
This type is the best for detailed crypto technical analysis. Each Candle contains the following data:
- Opening price
The price of the first transaction on the asset for this time period.
- Closing price
The price of the last transaction for this period.
- Maximum
The highest transaction price for the selected time period.
- Minimum
The lowest price of a deal for the selected time period.
- Candlestick body
A segment between the opening and closing prices, showing the price range for the given time interval. If filled in green or white, it means the close was higher than the open (a bullish candle). If filled in red or black, it means the close was lower than the open (a bearish candle).
- Wicks/Shadows
The thin lines above and below the body represent the high and low prices reached during that time period. The upper wick shows the highest price traded, while the lower wick shows the lowest price.
- Chart Timeframes
Choosing the right timeframe is pivotal for accurate analysis.
Let’s see how to read a crypto chart on this type. Candlestick colors visually display the bullish or bearish sentiment during that timeframe.
- Green/White Candle
These candles indicate buying pressure. The point of price closed higher than it opened. The bottom of the real body shows the open price, while the top shows the close price.
- Red/Black Candle
These candles indicate selling pressure. The point of price closed lower than it opened. The top of the real body shows the open price, while the bottom shows the close price. The logic of observing these candles is similar to green/white candles.
The size and shape of the candle body and wicks reveal key information. Large bodies indicate stronger conviction during that period. Long upper or lower tails show buyers or sellers stepping in and reversing the price.
Candlestick charts provide the most visually intuitive way to crypto technical analyze of price action. The shape and coloring of candlesticks immediately conveys important information on the trading range, direction and sentiment over a period. For this reason, candlestick charts are favored by most traders and technical analysts. Many consider them the best crypto charts.
Timeframes
Before you start analyzing a chart, you need to select its timeframe, the time interval that each candle on the chart displays (e.g., 1 hour, 1 day, 1 week). Here lies the key answer to the question how to read crypto charts.
An important point to note is that the larger the selected timeframe of the chart, the higher the probability of making a correct forecast of further price movement.
To successfully invest in cryptocurrencies, you should primarily consider charts with a large timeframe (e.g., a daily chart) to identify and track the global trend. Afterward, you can move on to analyzing 4-hour and 1-hour crypto charts.
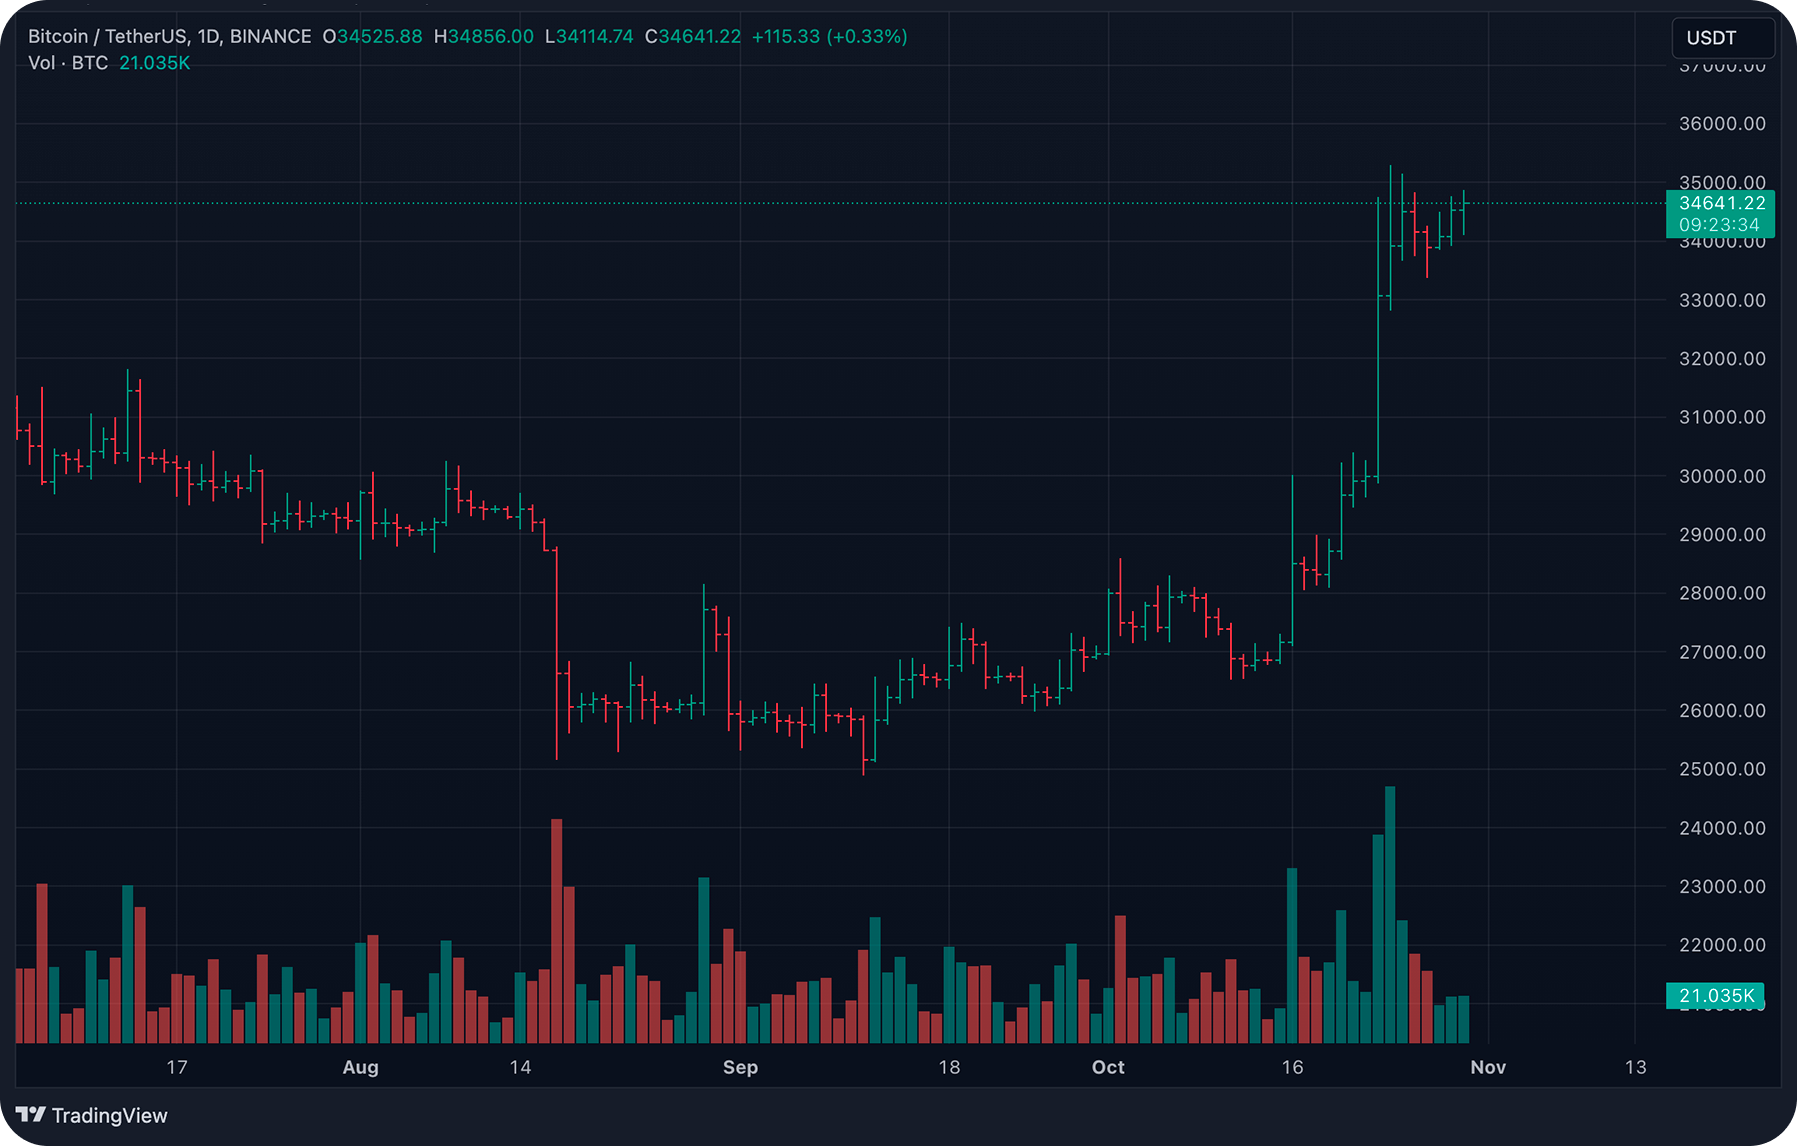
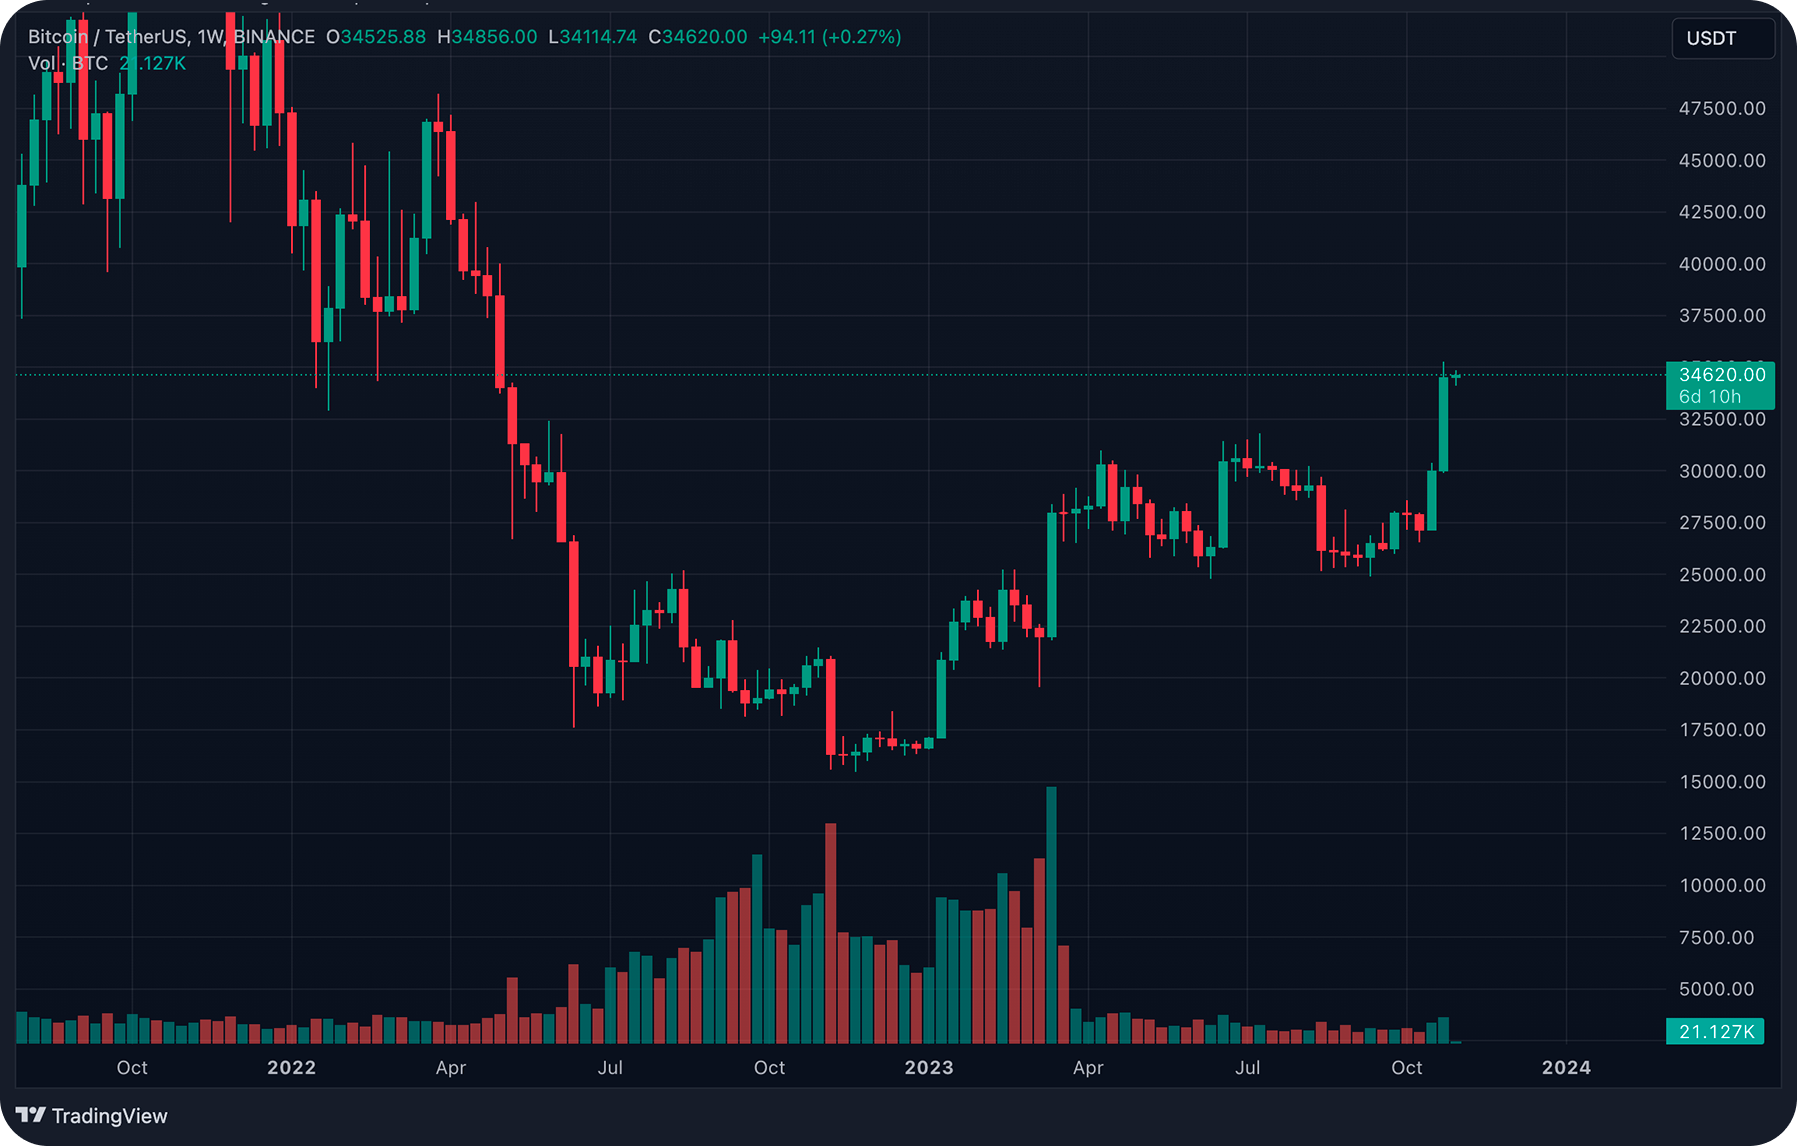
Timeframe options may be different, each of them demonstrates its own crypto chart patterns. Minute charts where each candle shows the price change over 5, 15, or 30 minutes (M5, M15, M30). Hourly timeframes, where each candle displays the price change for 1 or 4 hours (H1, H4). Daily chart, where each candle shows the price change for 1 day (D1). Weekly chart, where each candle shows the price change for 1 week (W1).
To understand how to read a crypto chart, it is important to assess charts across multiple timeframes, from the short term noise to the big picture trend. Traders may scan short term charts to time entry and exit points, while still basing their overall strategy on the trend identified from longer timeframes.
How to Identify Trends & Trend Phases
Price action refers to the actual movement of price on the chart over time. Analyzing price action is crucial for identifying trends, support/resistance levels, and crypto chart patterns.
Trends
When discussing trends in the crypto market, it refers to the direction in which the price of an asset is moving.
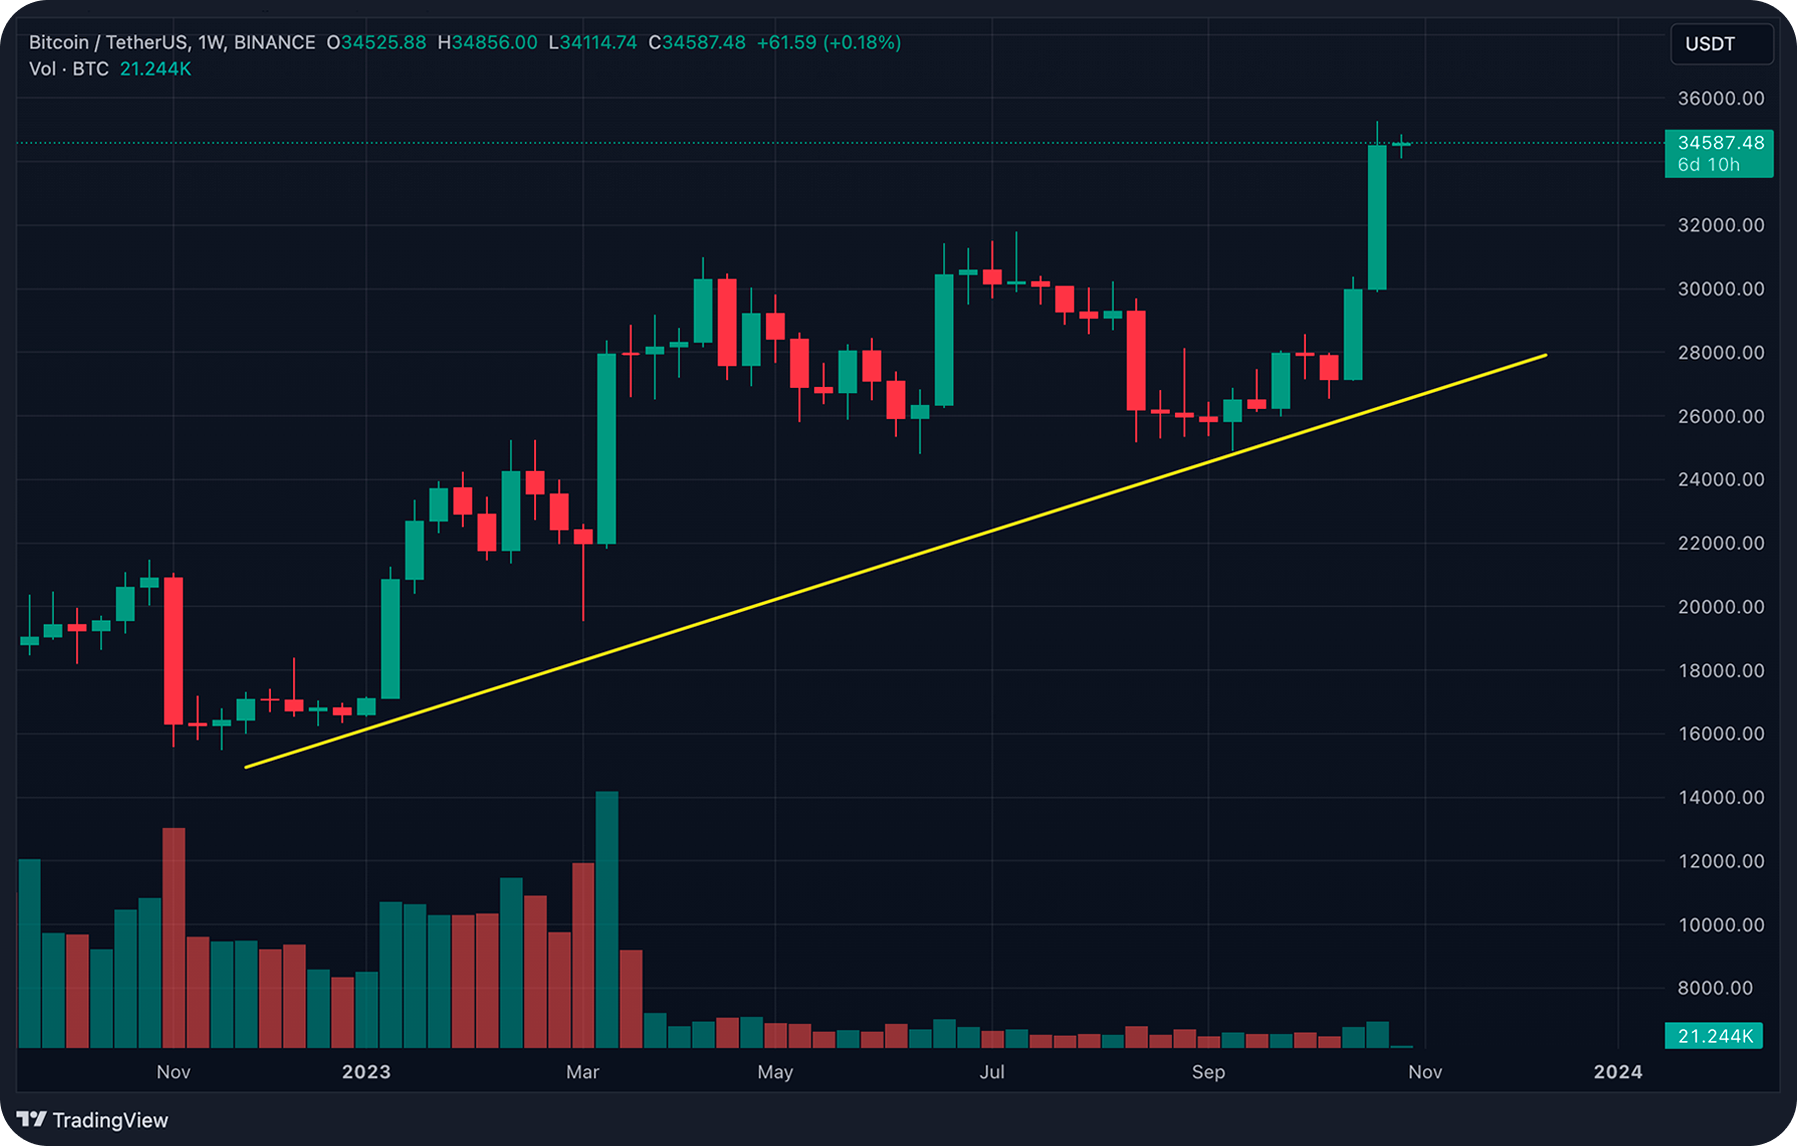
- Uptrend (bullish)
In an uptrend, prices consistently form higher highs and higher lows over time. This indicates a strong buying interest and a positive market sentiment.
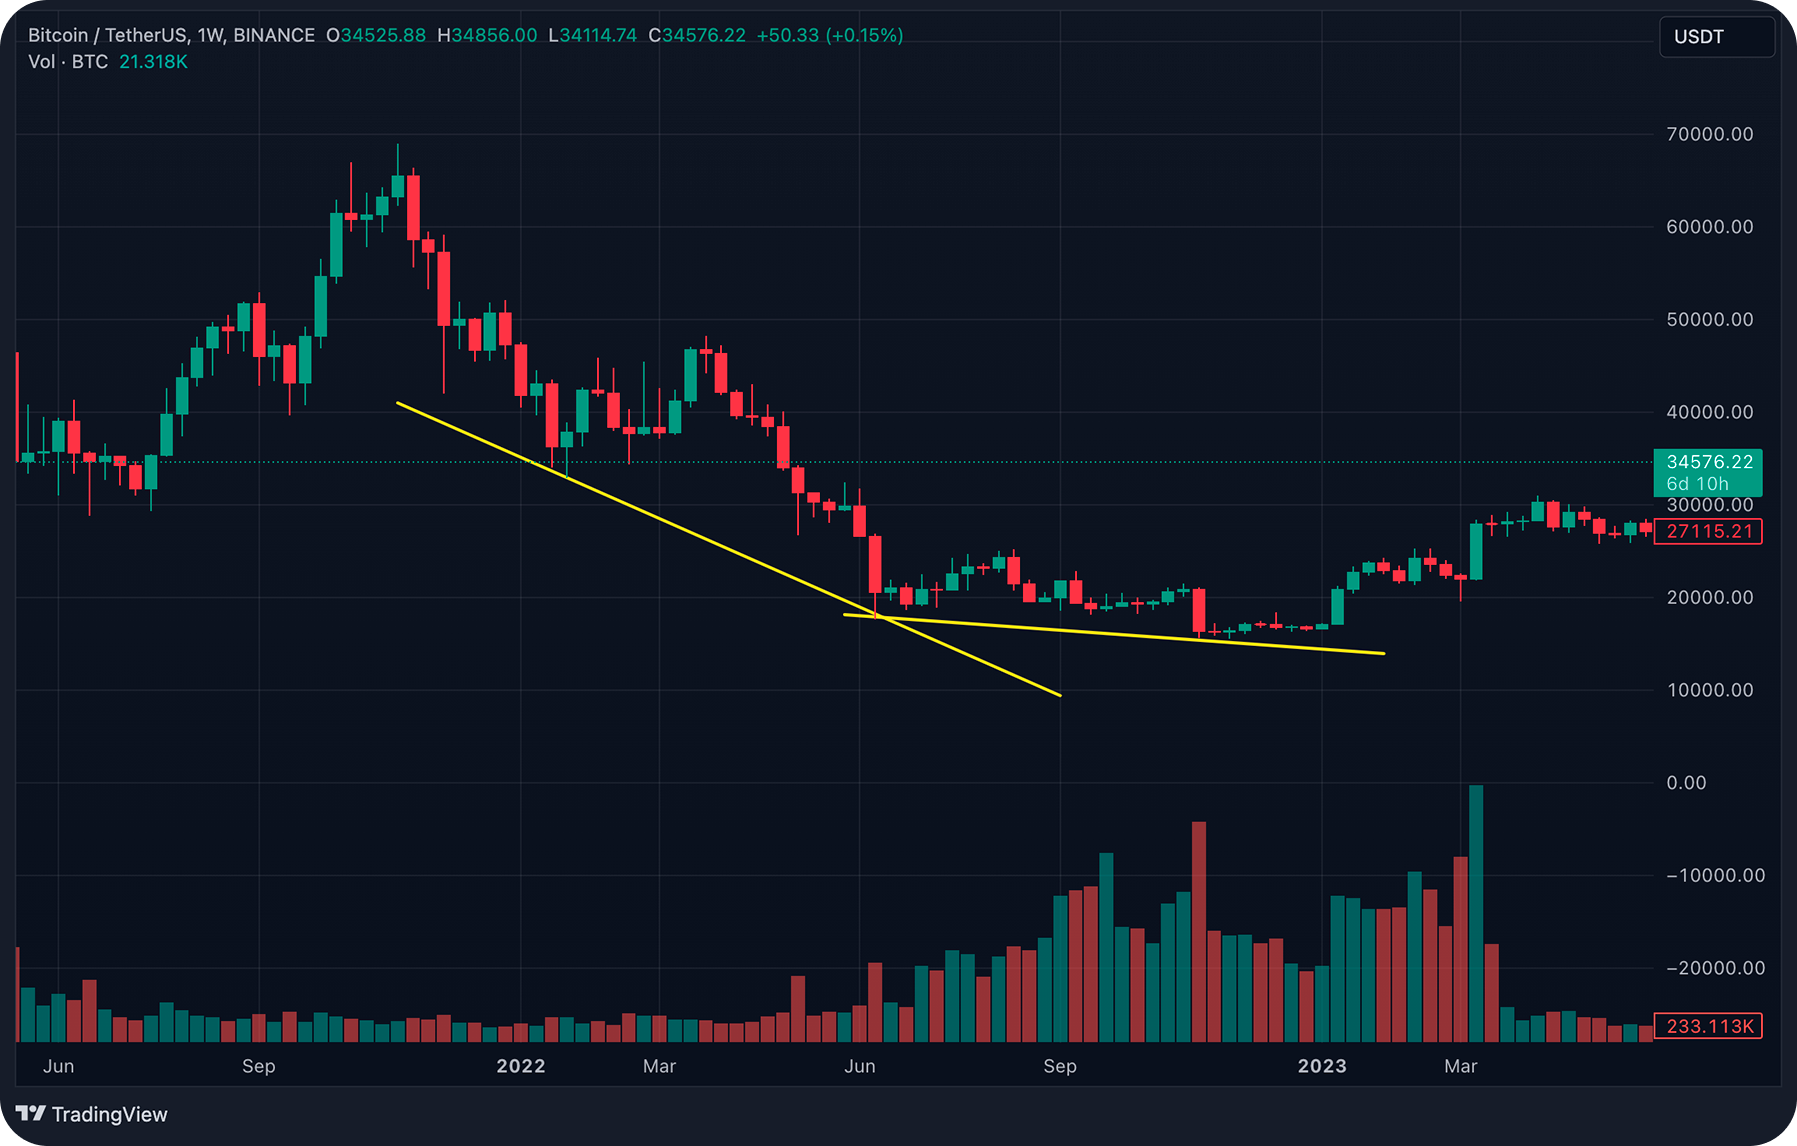
- Downtrend (bearish)
A downtrend is characterized by lower highs and lower lows. This crypto chart pattern suggests a prevailing selling interest and a negative market sentiment.
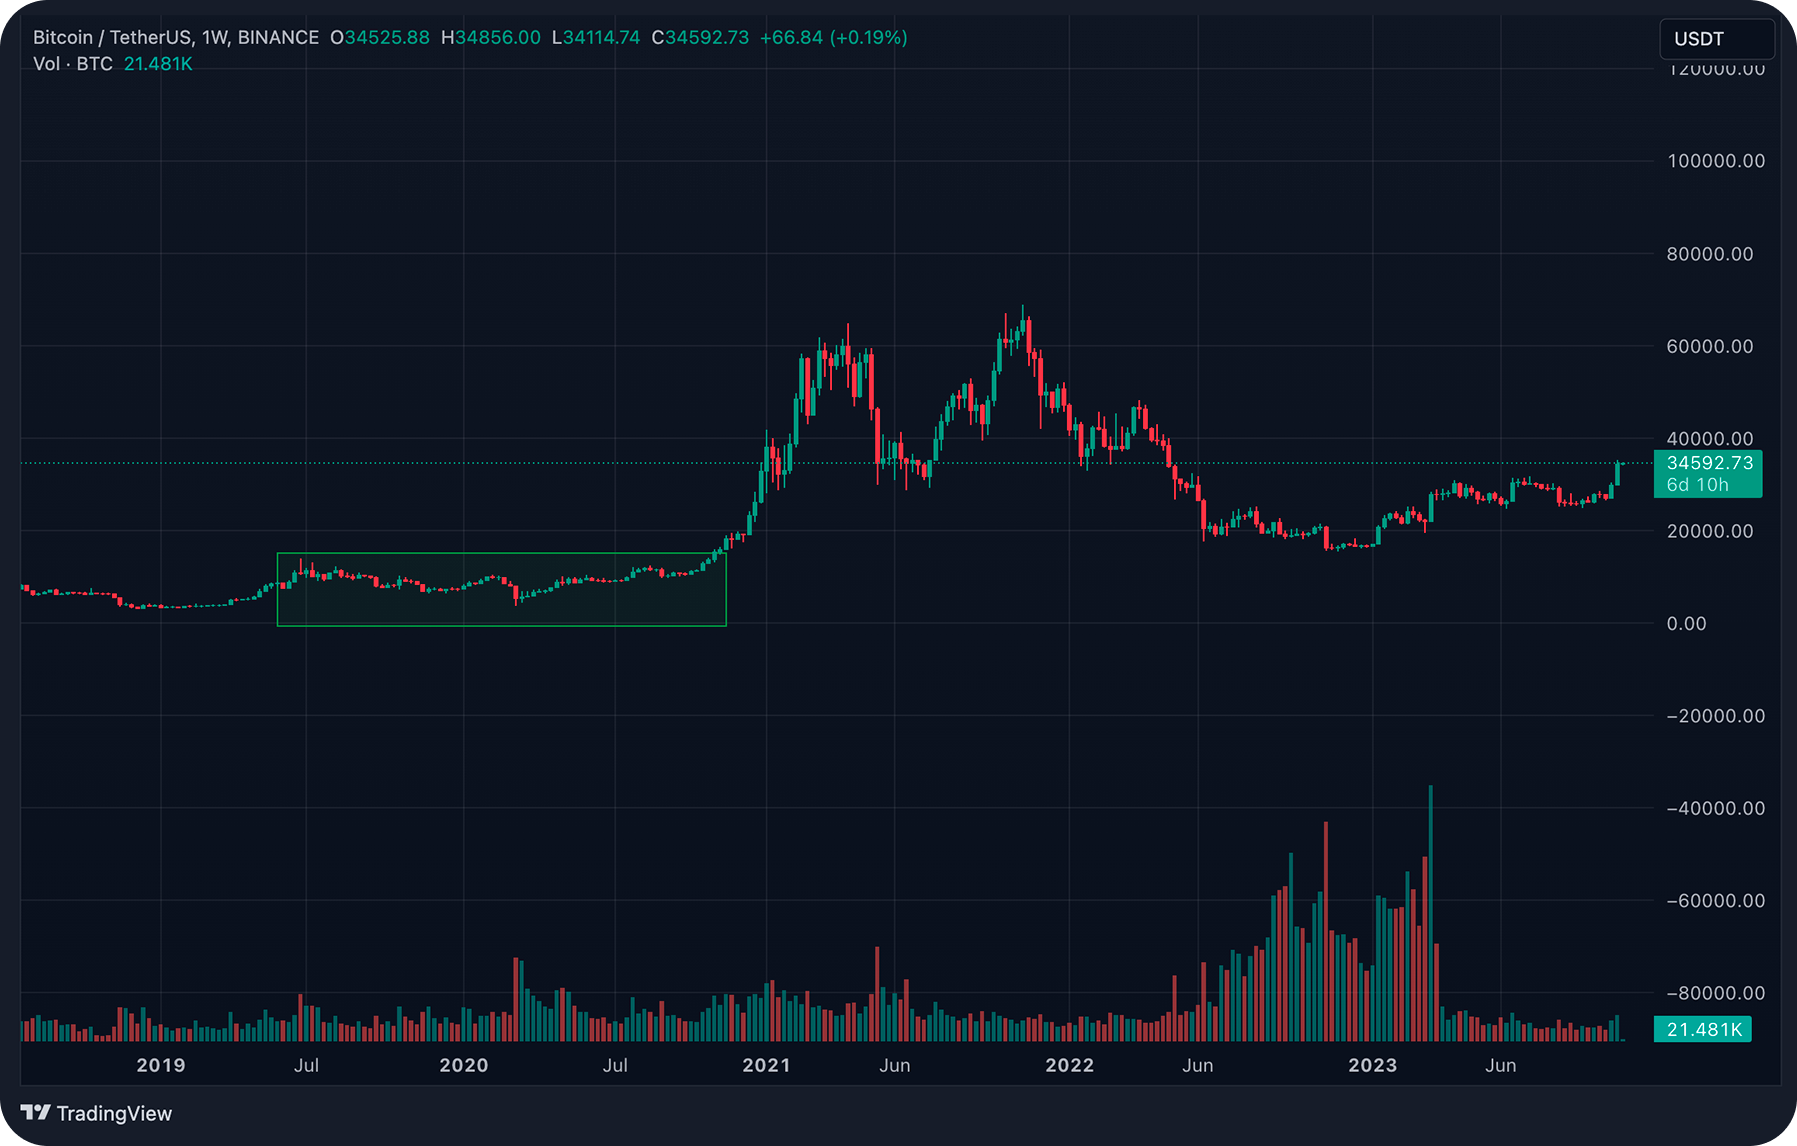
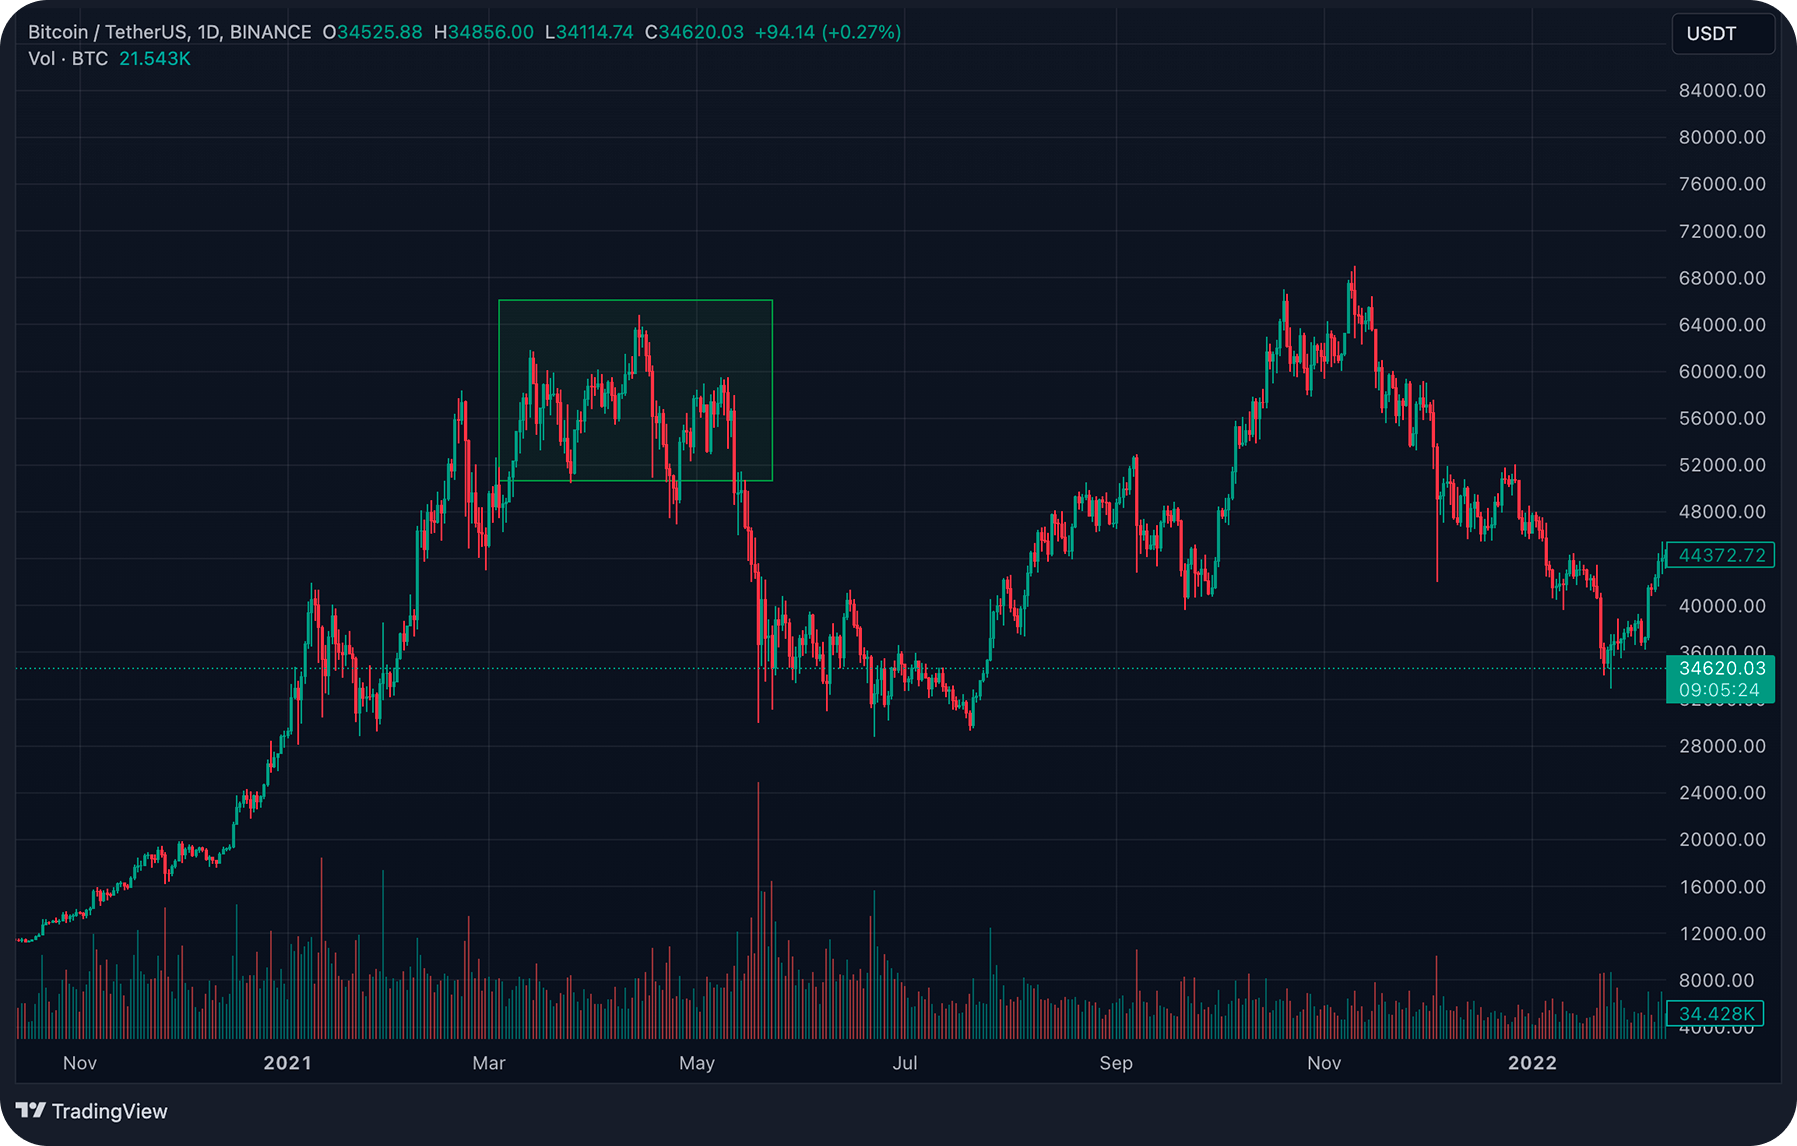
- Horizontally (sideways trend, consolidation, flat)
During a sideways trend, prices move within a narrow range without forming distinct higher highs or lower lows. This often indicates market indecision or a period of consolidation.

Identifying trends
- Observing highs and lows
To determine a trend, traders examine the sequence of recent highs and lows. In an uptrend, each new high and low is higher than the previous ones. Conversely, in a downtrend, each new high and low is lower than the previous ones.
- Drawing trendlines
To make crypto technical analysis, traders draw trendlines by connecting swing points, which are significant highs or lows. A trendline in an uptrend connects successive higher lows; in a downtrend, it connects successive lower highs. Trendlines provide a visual guide, clarifying the established trend direction.
According to the Dow Theory, several trends of different time scales can be present in the market at the same time:
- Global trend
Demonstrates the general direction of price movements in the long term. It helps investors identify the primary market sentiment and fundamental shifts.
- Medium-term trend
Shows price changes within the global trend.Traders use this trend to capture intermediate movements and adjust their strategies accordingly.
- Short-term trend
A temporary change in the asset’s price that occurs over a short period of time, usually from a few hours to a few days. Traders often focus on short-term trends for tactical, rapid decision-making.
Trend phases
Trend phases represent different stages of price movement in the market. In the world of crypto technical analysis, trends can have several key phases, each denoting a specific stage of market forces and investor behavior. Let's see what these phases include to find out how to read crypto charts:
- Accumulation
The initial phase when major players begin buying up assets. This phase begins at the end of a downtrend and is often accompanied by a prolonged sideways movement.
- Public Buying
In this phase, the trend reversal becomes obvious, and active buying of assets begins. Trading volumes on the market begin to increase, and there is a lot of positive news in the media. The number of market participants also begins to increase, and price highs start to be updated regularly.

- Fixing (Selling)
When prices reach highs, experienced traders start to close their positions and sell assets at high prices, securing profits. Beginners, on the contrary, believe in the continuation of the upward movement and may start buying, which helps experienced traders sell their assets at high prices. This marks the reversal phase of the trend.
Crypto chart analysis is crucial for traders to spot price trends, with Dow Theory principles from the late 1800s still relevant. Candlestick charts offer insights into market psychology.
Traders should analyze various timeframes, with higher ones offering more reliable signals for trend determination and shorter ones for timing trades. Combining chart analysis with indicators and risk management can lead to profitable crypto trading.
BTC and other cryptocurrencies can be purchased on SimpleSwap for crypto or fiat.
The information in this article is not a piece of financial advice or any other advice of any kind. The reader should be aware of the risks involved in trading cryptocurrencies and make their own informed decisions. SimpleSwap is not responsible for any losses incurred due to such risks. For details, please see our Terms of Service.


