BTC Pre-Halving Price Analysis

This blog post will cover:
- Technical Analysis
- On-Chain Analysis
Bitcoin trades near $66.5K 4 days before the halving event with technical and on-chain analysis suggesting the potential for bullish trend continuation.
Technical Analysis
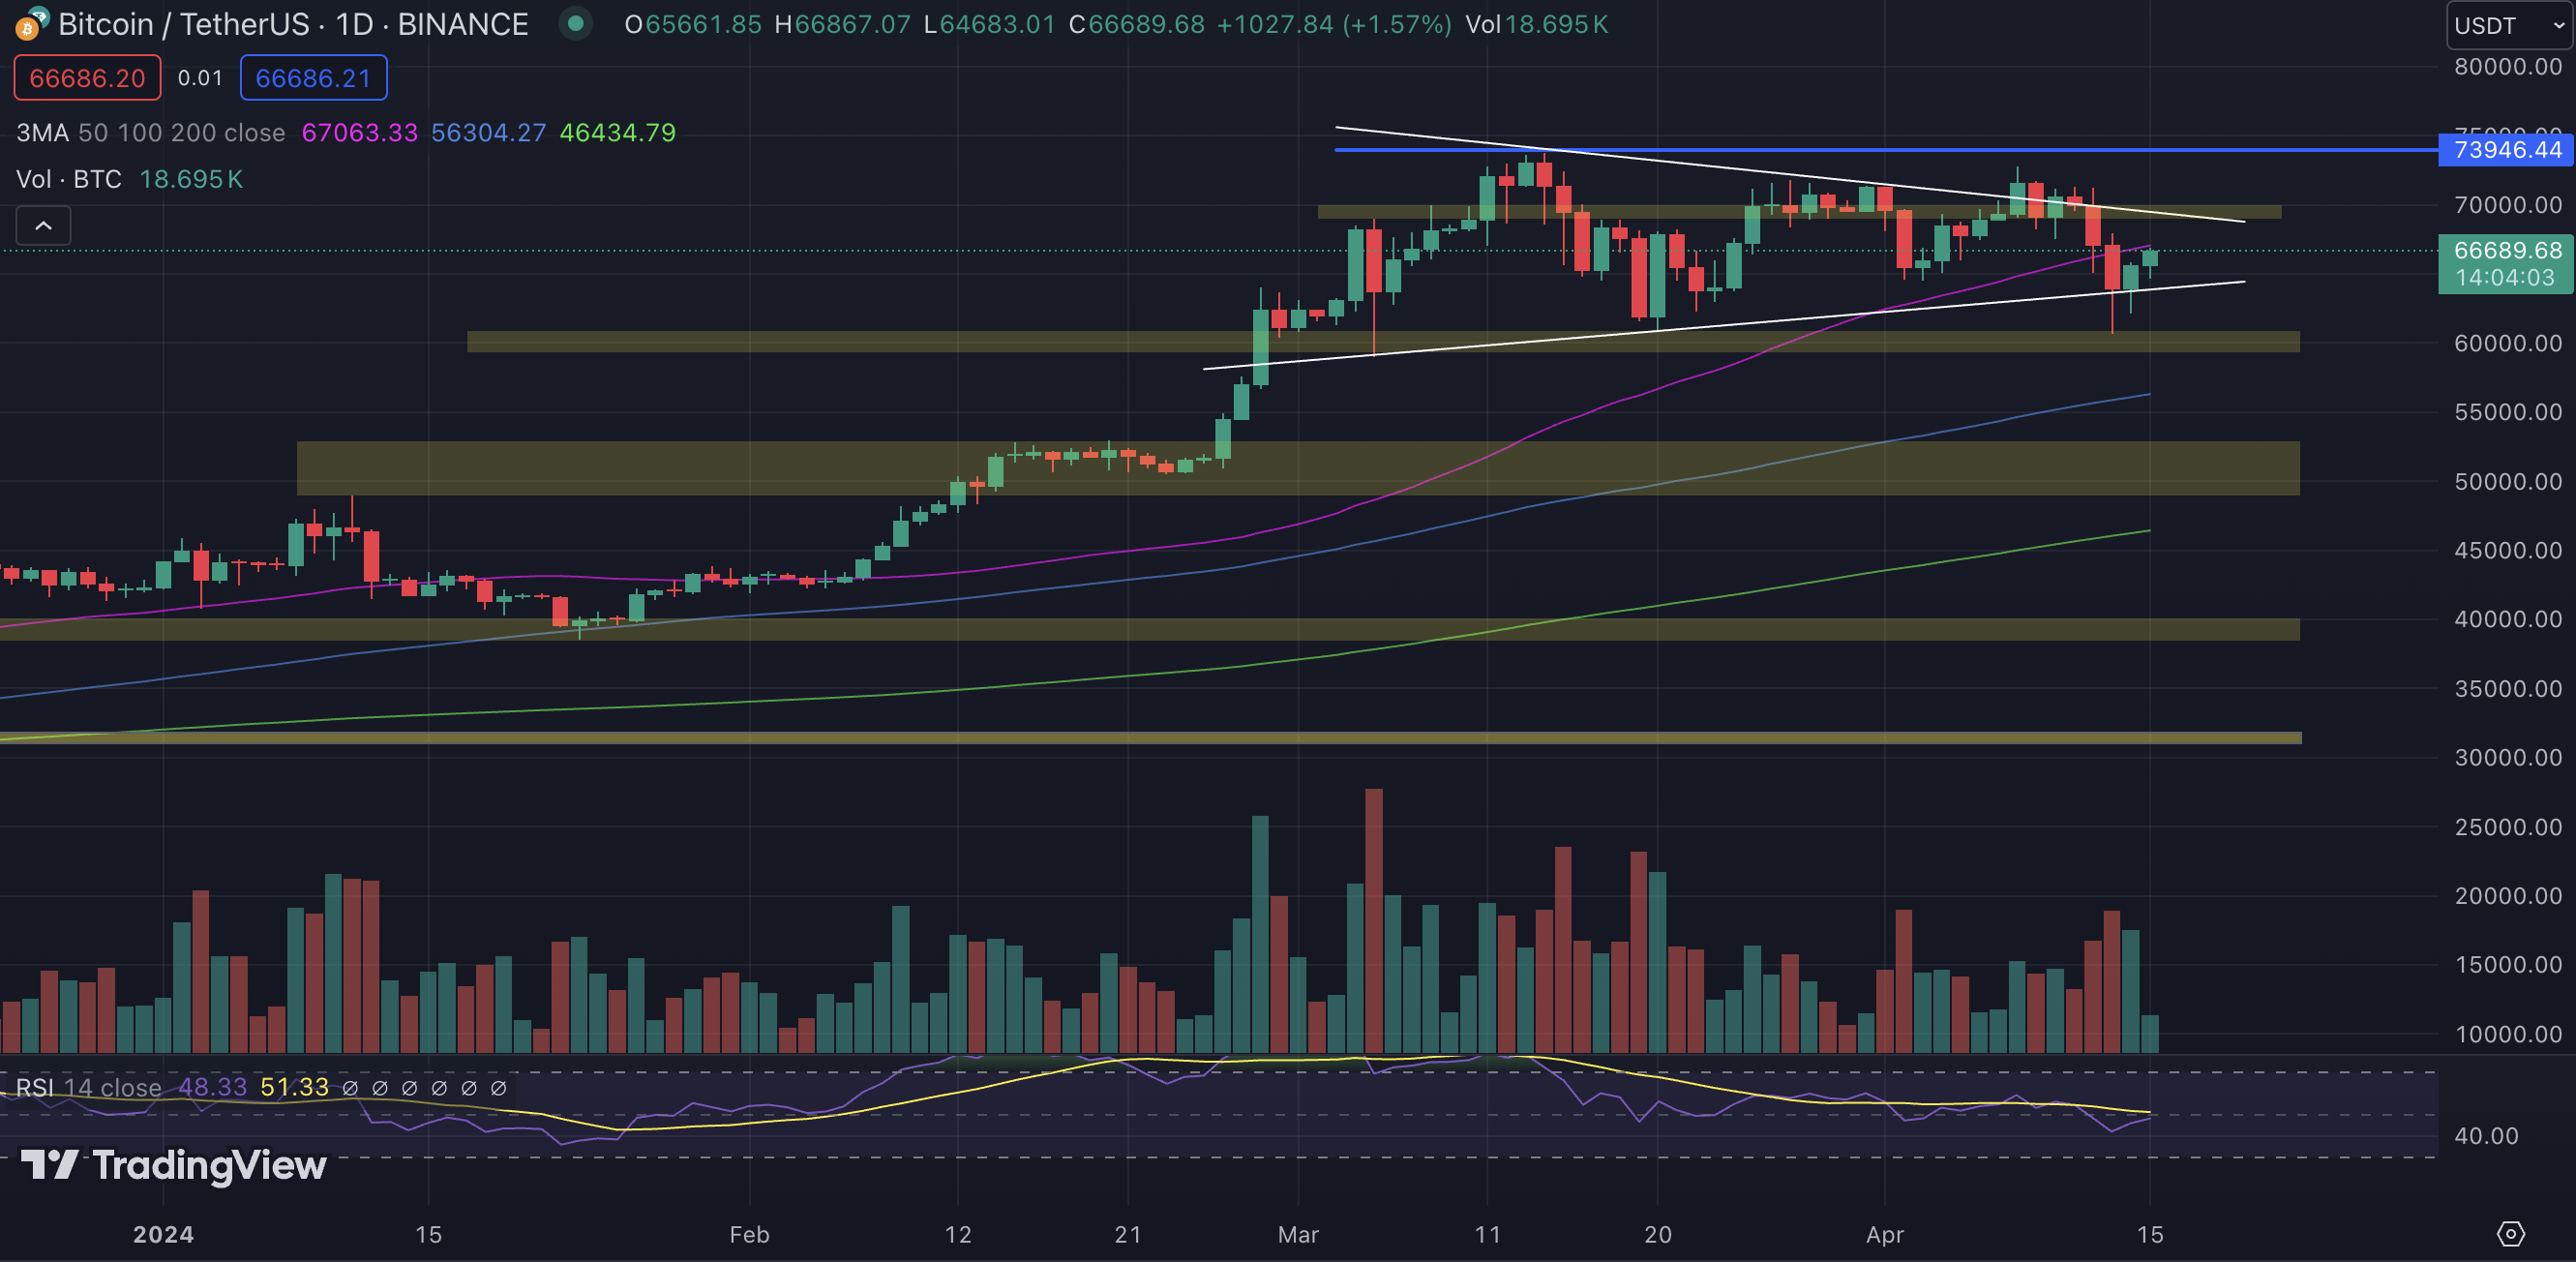
Following its surge to an all-time high above $73K, BTC experienced a correction, finding support in the $61K-$60K range. On the daily timeframe, BTC has shaped a symmetric triangle pattern, typically indicating a continuation of the existing trend. On April 8, a breakout above the upper boundary of the triangle took place, suggesting the potential for upward movement.
However, following higher than expected CPI in the US and geopolitical crisis in the Middle East, BTC's price swiftly corrected, dropping to $60.6K on Saturday the 13th, leading to $955M worth of traders' positions being liquidated ($767M in longs).
Despite this significant decline, there is a noticeable bounce from the lower border of the triangle, with the RSI indicating a neutral market sentiment. Unless another "black swan" event occurs, BTC may soon test the $69K zone.

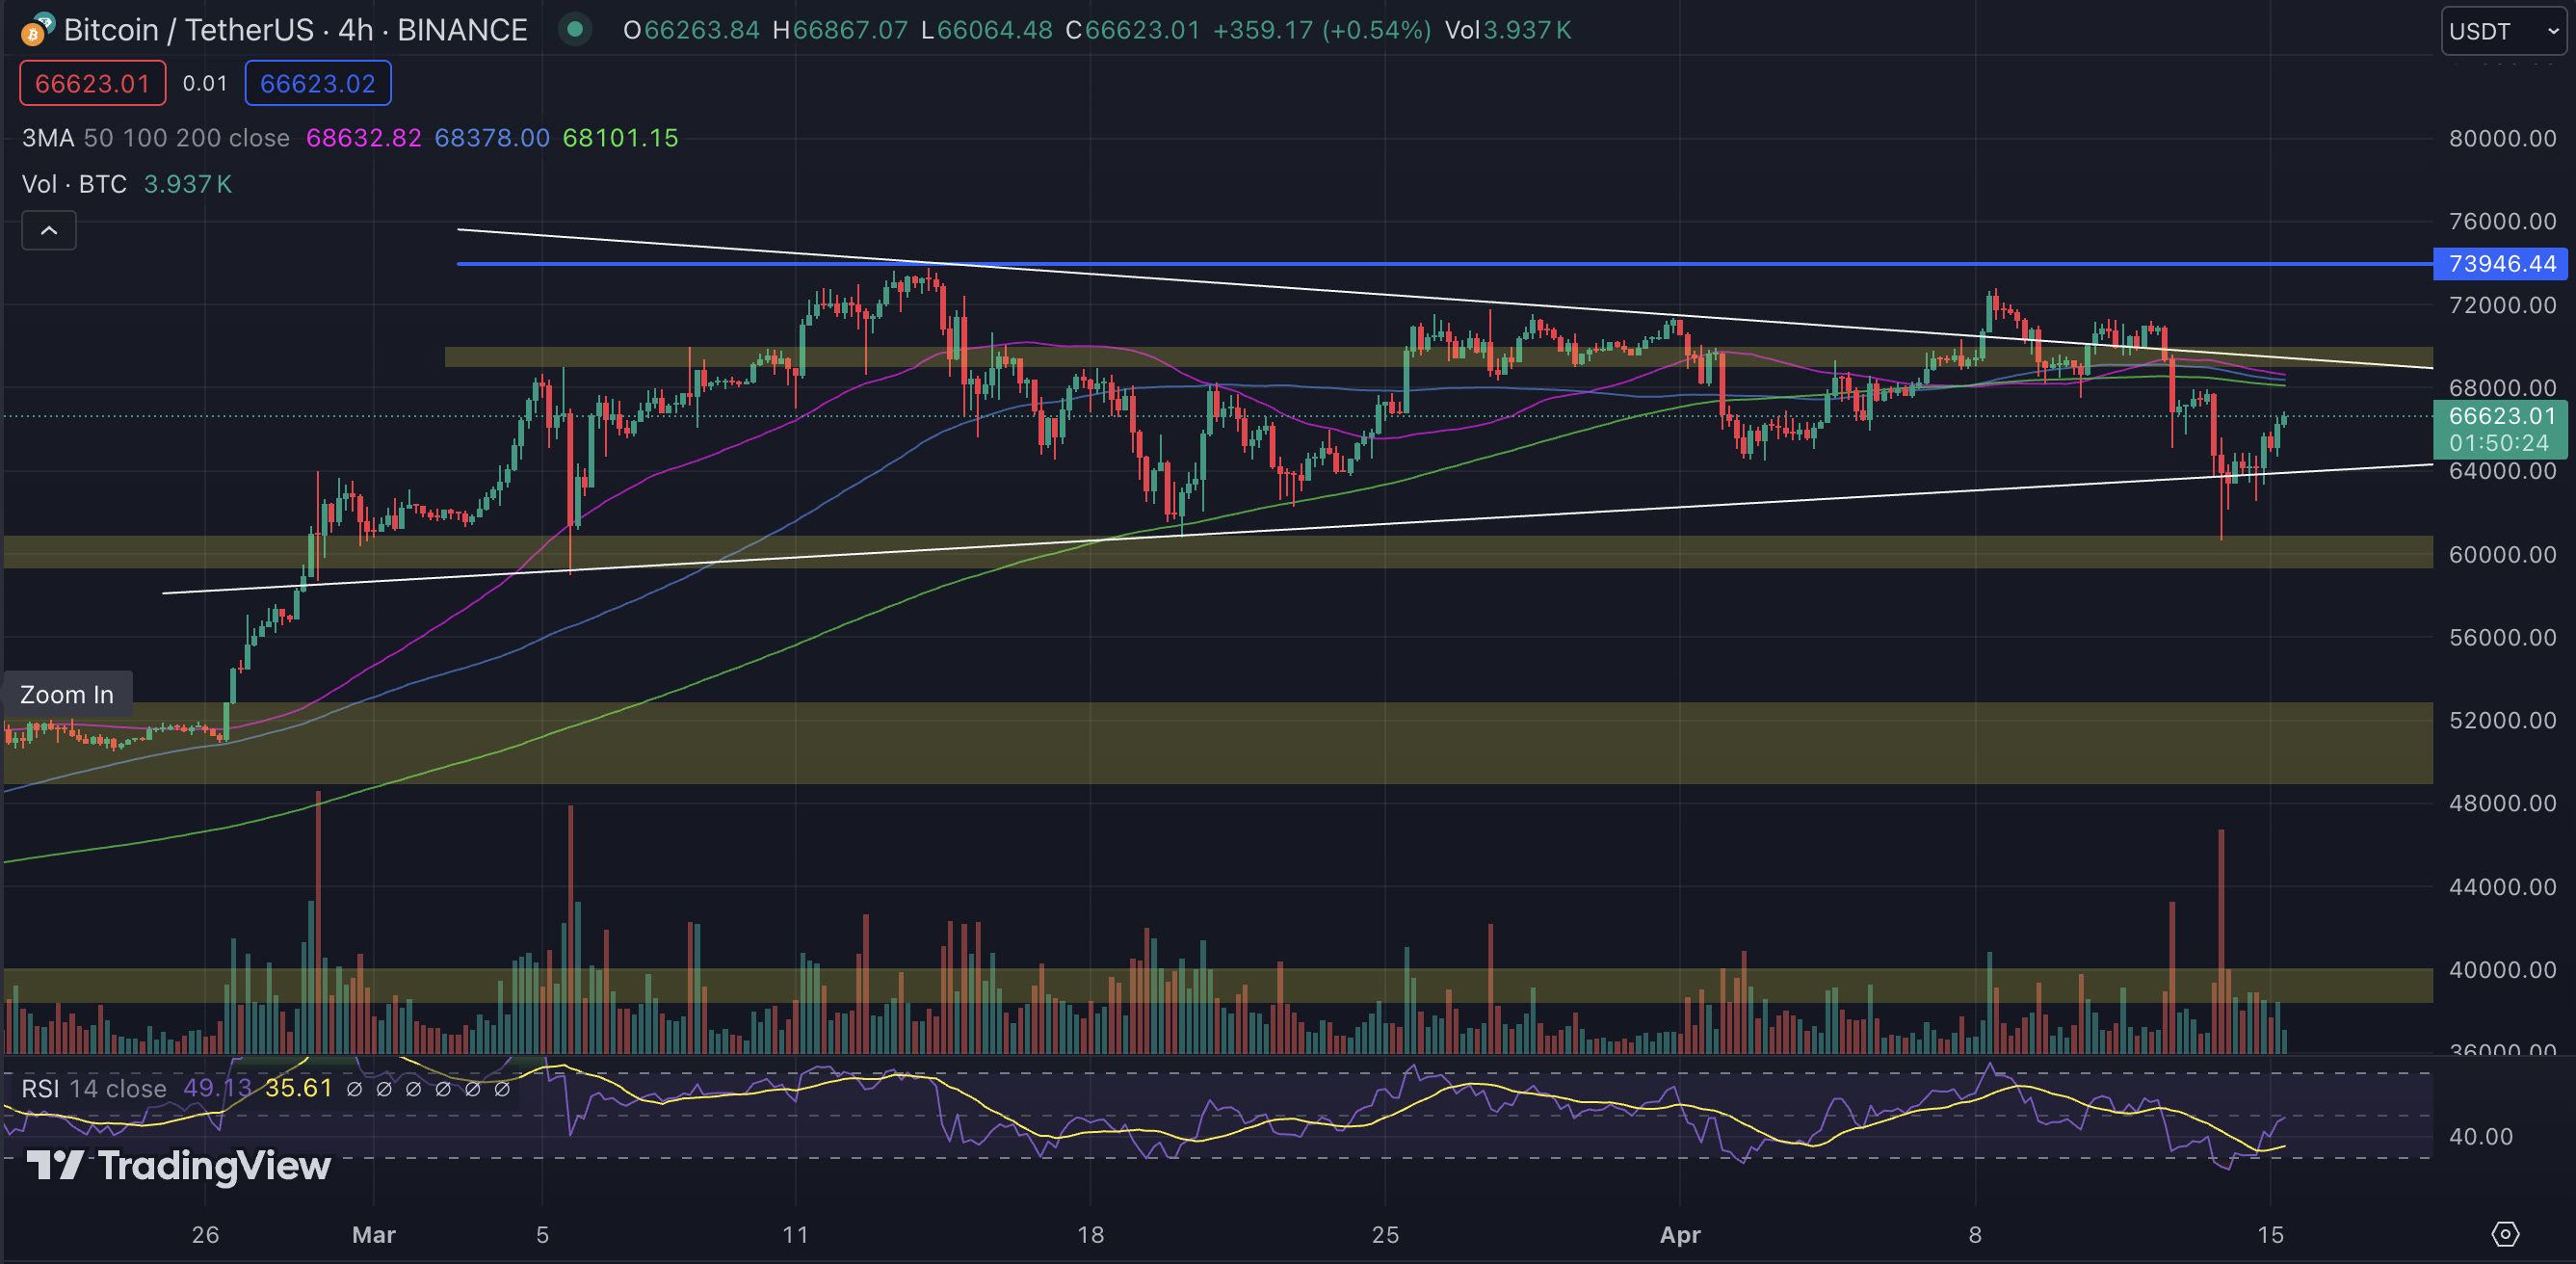
On the 4H timeframe, there is a clear price rebound from the lower border of the trading channel, with a support zone between $60.8K and $59K. As of the time of writing, BTC is trading near $66.6K. The next potential resistance levels for the asset to test could be the moving averages (50-day, 100-day, 200-day).

On-Chain Analysis
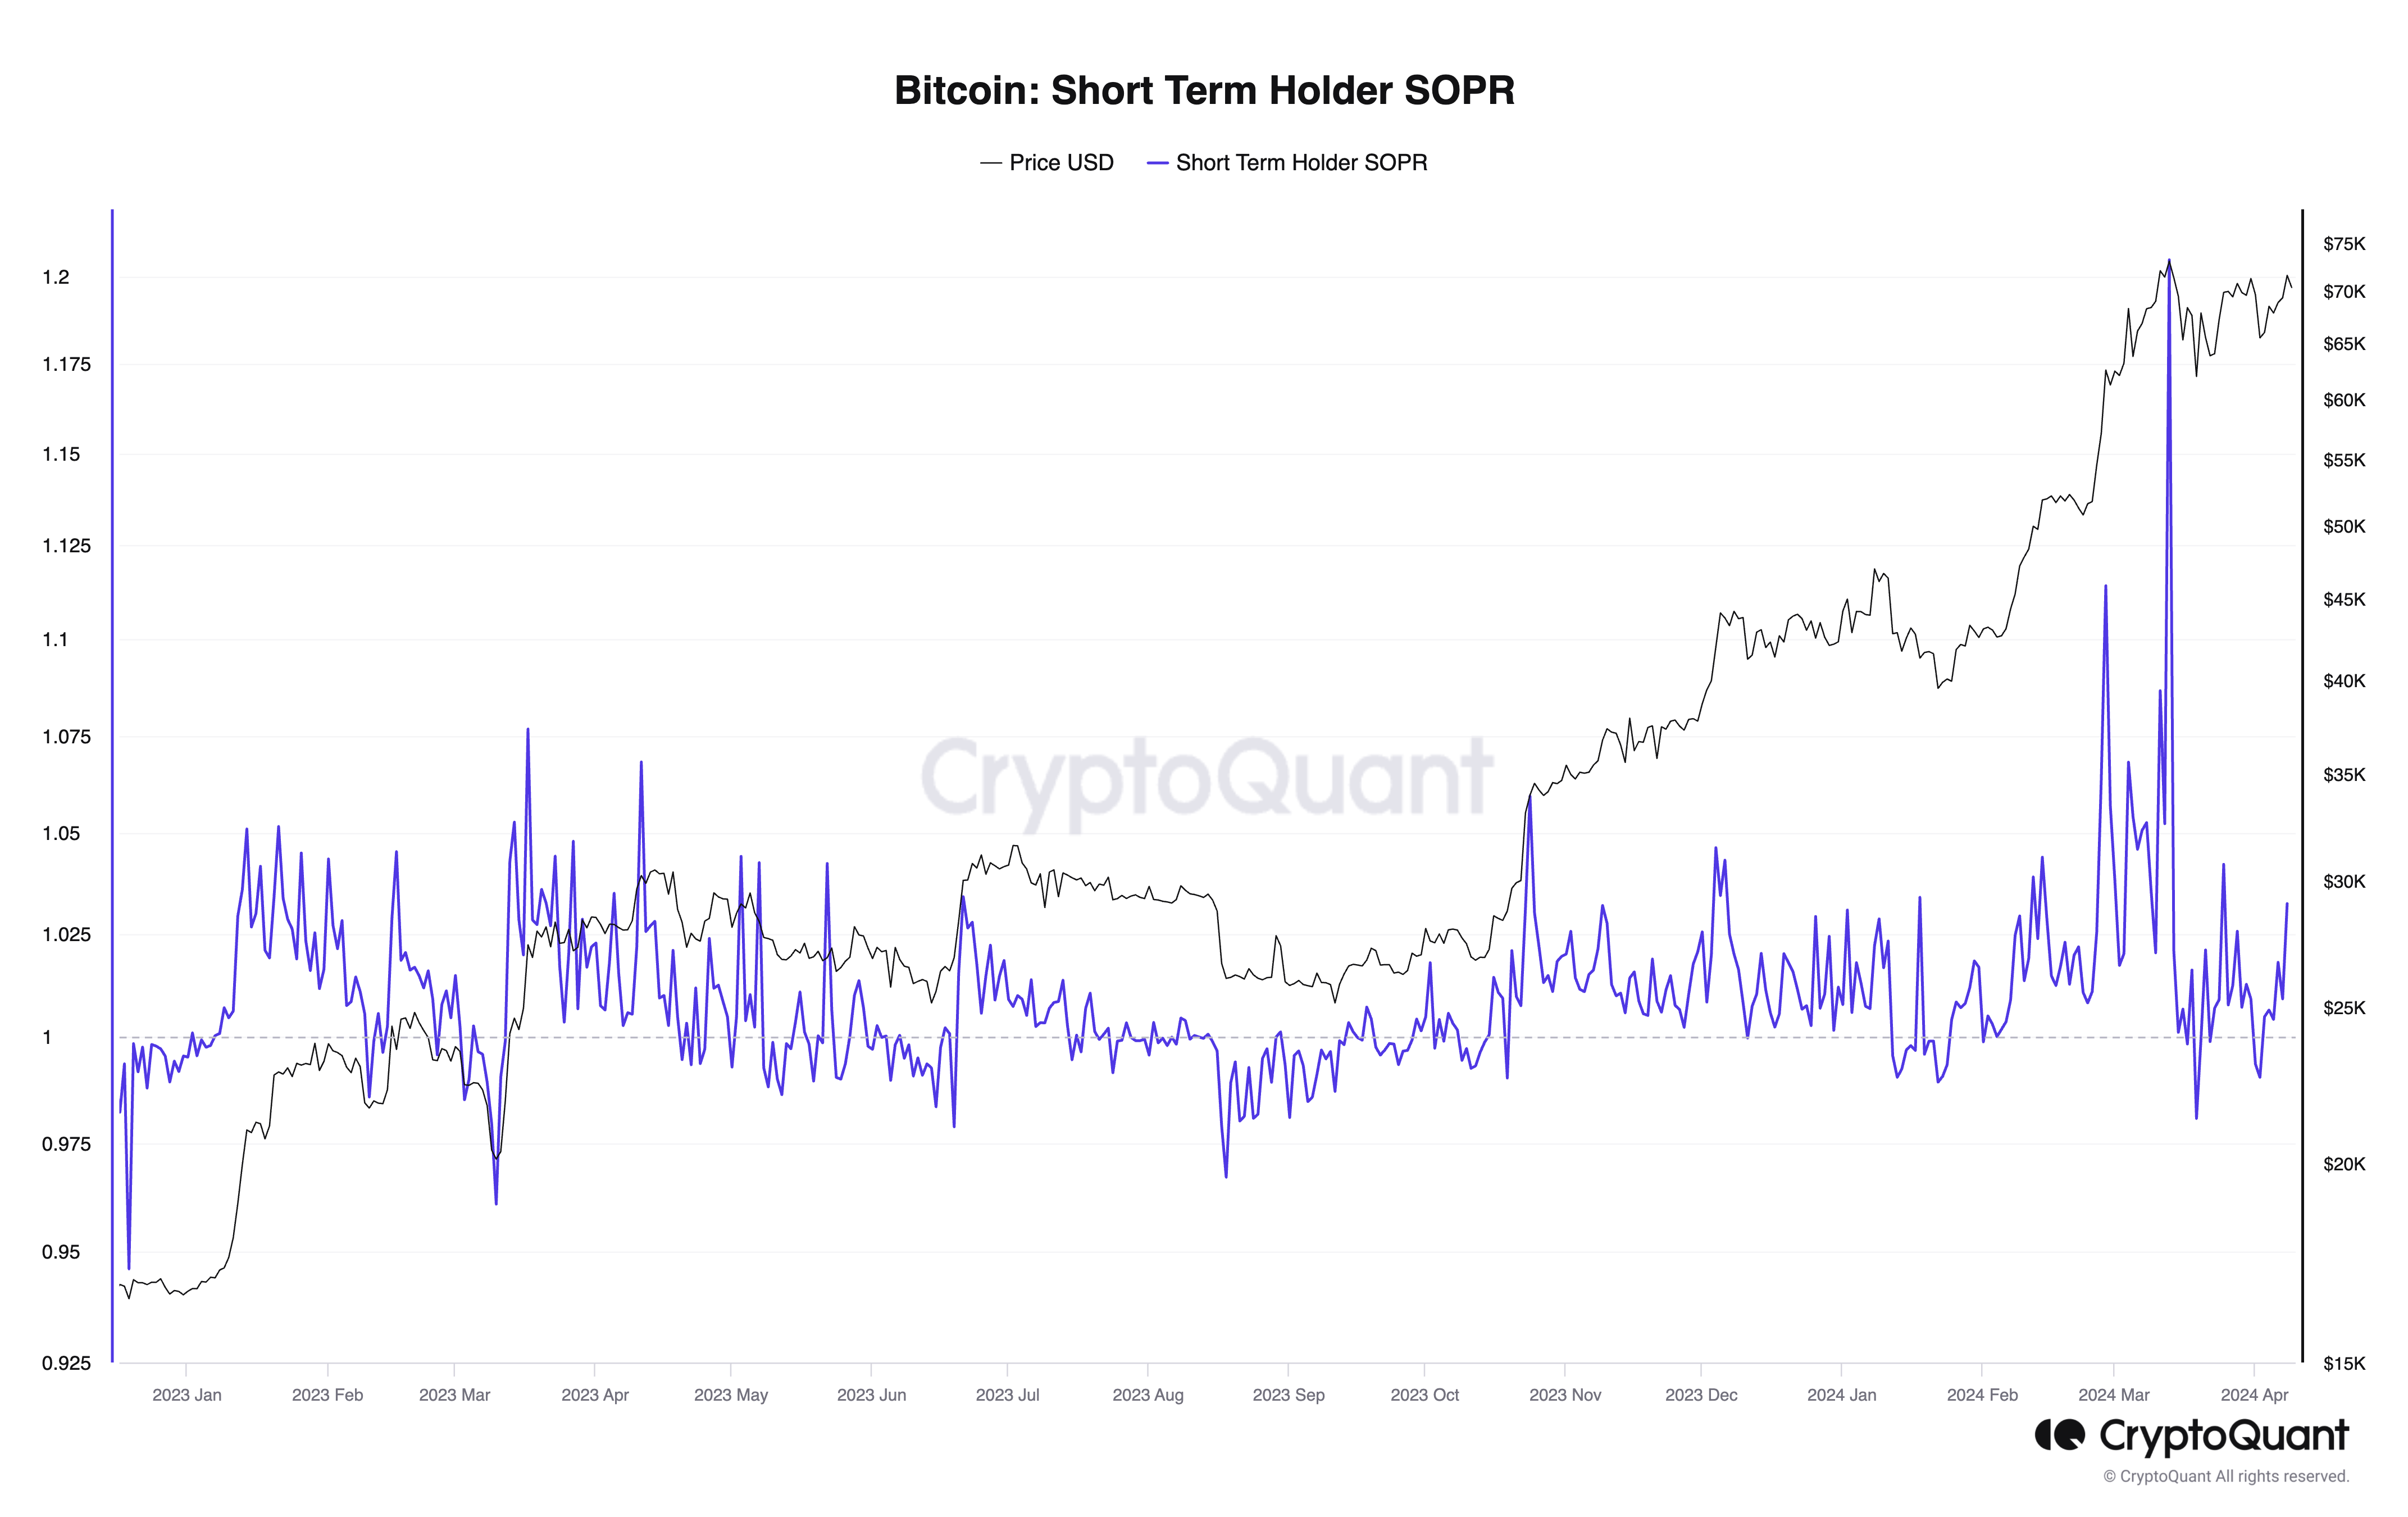
One of the triggers impacting BTC price movement is profit-taking by market participants. As the price reaches new highs, investors often opt to cash out and sell their assets. In March, when BTC hit an all-time high, a similar pattern emerged, with BTC holders, particularly short-term, selling off their holdings to lock in profits. According to Cryptoquant, short-term output profit ratio surged above 1.2 (value over 1 indicates more short-term investors are selling at a profit). This selling pressure contributed to the recent correction in BTC price. However, it appears that this selling pressure is now weakening, signaling the end of the profit realization phase.

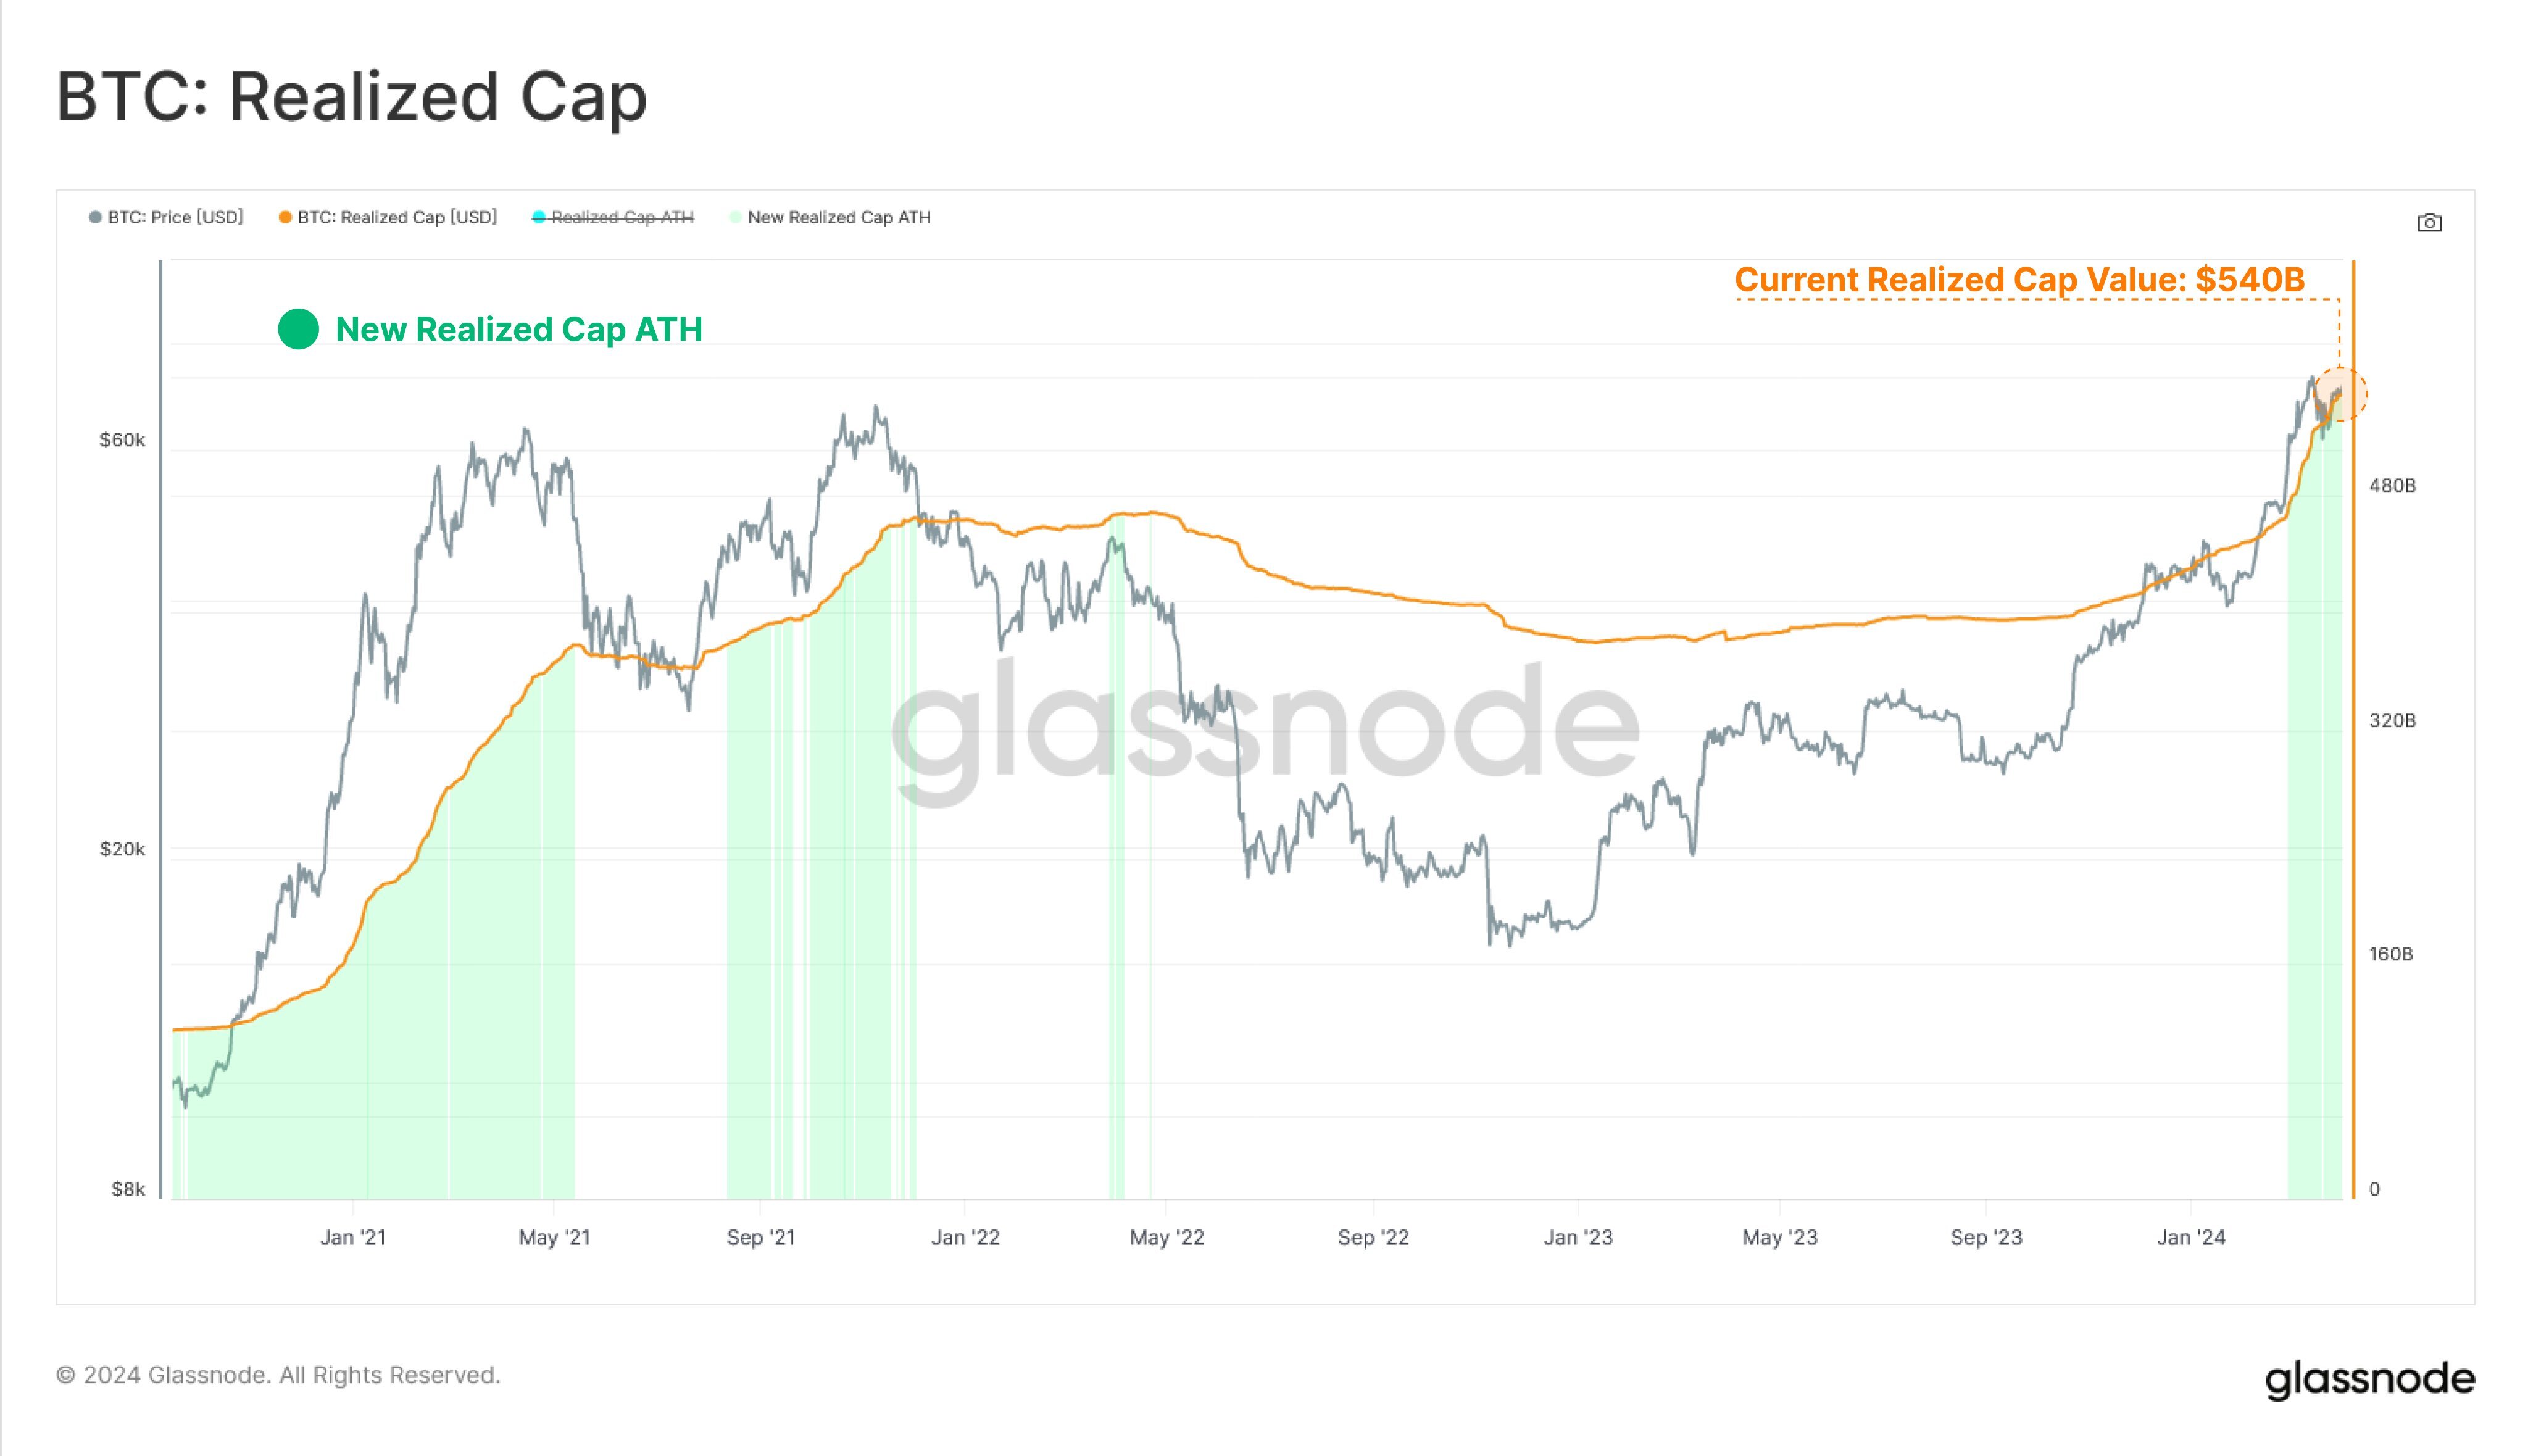
BTC price growth is also fueled by a surge in liquidity inflow, reaching unprecedented levels. BTC Realized Cap that represents the cumulative USD liquidity in BTC assets, recently hit an all-time high of $540B with an average monthly increase of over $79B. The influx of fresh capital is bolstering the price of Bitcoin and enhancing the likelihood of reaching new highs in the near future.

Upcoming halving could potentially lead to increased volatility on the Bitcoin markets with significant price fluctuations. Traders and investors should exercise caution while trading BTC during this period and carefully assess all associated risks.
SimpleSwap reminds you that this article is provided for informational purposes only and does not provide investment advice. All purchases and cryptocurrency investments are your own responsibility.

