Market Overview: August 2024
This blog post will cover:
- Market Performance | Bitcoin and Altcoins
- Dominance of Bitcoin and Altcoins
- Ganers&Loosers
- State of DEFI
- Conclusion
After a mixed July where crypto investors were spooked by news of the German government selling bitcoins and the start of payouts to investors affected on the MTGox exchange, August was just as volatile with a strong correction at the beginning of the month that dropped Bitcoin below $50k and a recovery period at the end of the month to $64.5k.
The main reasons for such a fall at the beginning of the month were poor data on the US labor market, fears of a recession, serious sales from a major player in the market making Market Jump Crypto and geopolitical tensions. As a result, Bitcoin fell by 20%, and Ethereum by 29%. On August 5, traders received more than $1 billion in liquidations. On-chain liquidations reached $350 million. The end of August turned out to be more positive and showed a market recovery to around $60k per Bitcoin, Ethereum looks weaker in a pair with Bitcoin at the moment, but more on that further on in the report.
August was marked by both positive and negative news from the TOP players in the crypto industry. 2 top blockchains - Tron and Ton performed differently this month. Justin Sun, the head of Tron, launched the SunPump Meme platform for memecoins and activated the hype for Tron, the price of which soared by more than 20% in a week. On the other hand, the equally popular Ton fell by more than 20% due to the arrest of Pavel Durov and his accusation of several articles of the criminal case.
But more on this in our monthly report from the Simple Swap team.
Market Performance | Bitcoin and Altcoins
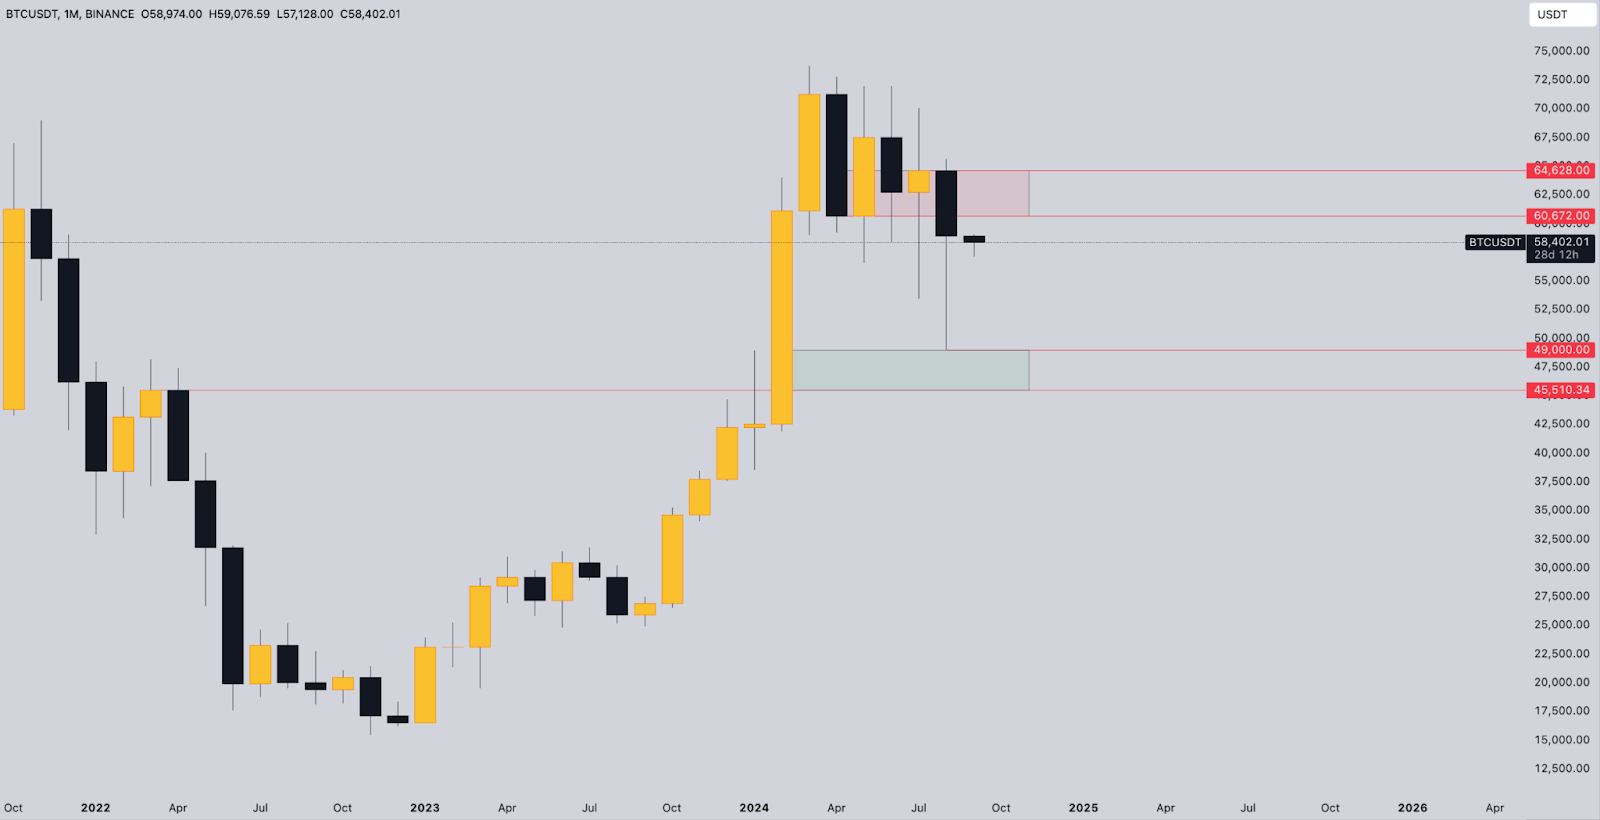
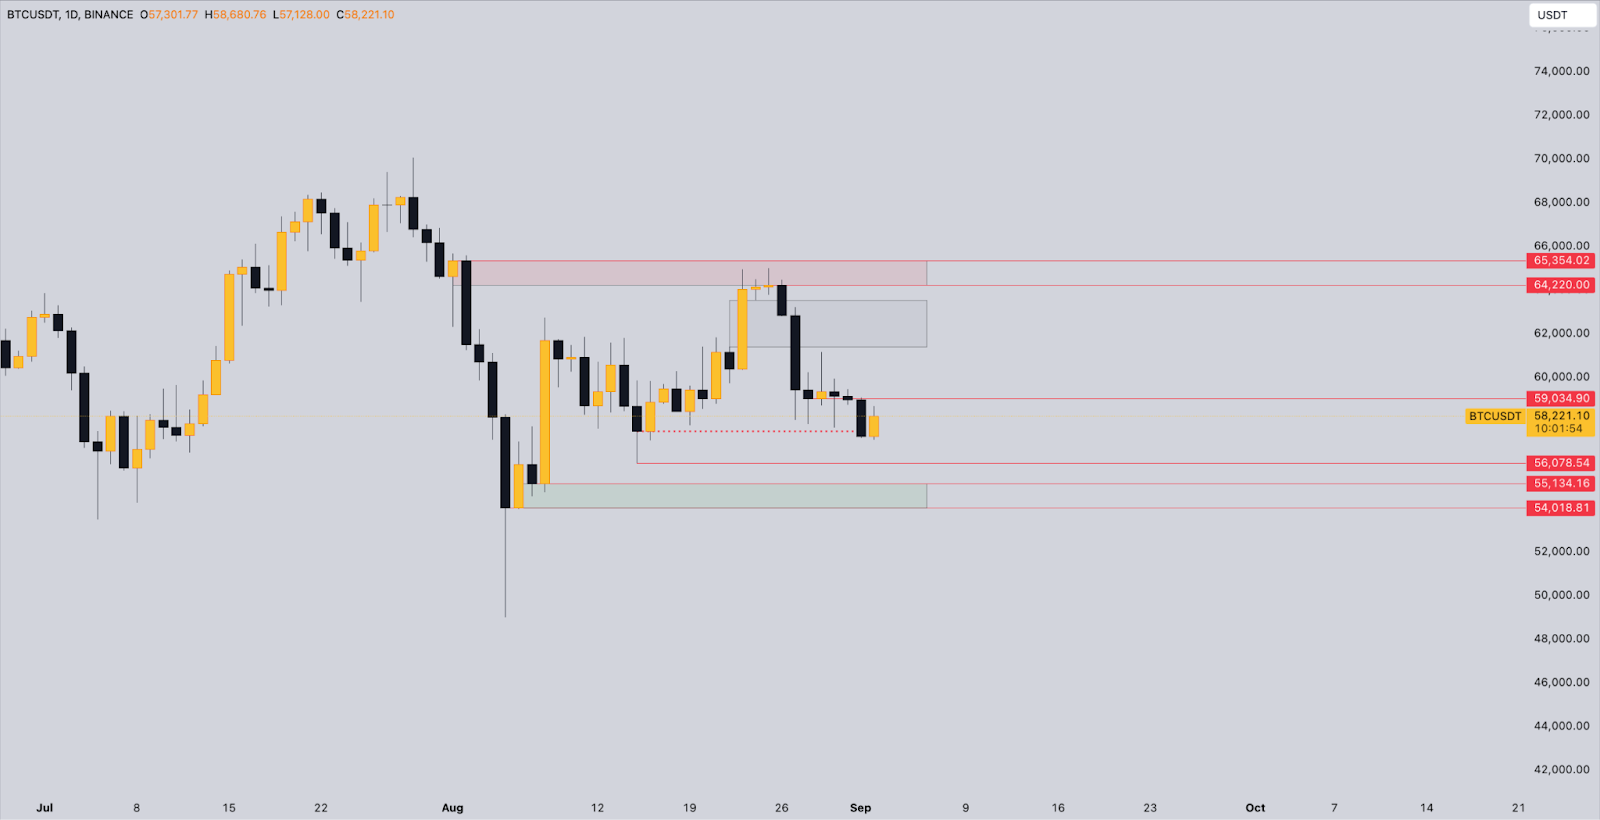
August has been quite volatile for BTC and the entire crypto market. On the last day of the month, Bitcoin settled at $58,923, showing growth after a strong drop of more than 20% at the beginning. However, closing below the $60,670 mark, which has been held since March, leaves cause for concern for the first month of autumn.
The trend of lowering highs and lows remains relevant. In order to return to the upward local trend, a test of the key resistance zone on the monthly chart is necessary, the lower border of which stands at $60,670. In this zone, there is an inefficiency at $64,220 on the daily charts, but it is not yet clear how we can get there in the near future - an ambiguous September is ahead.
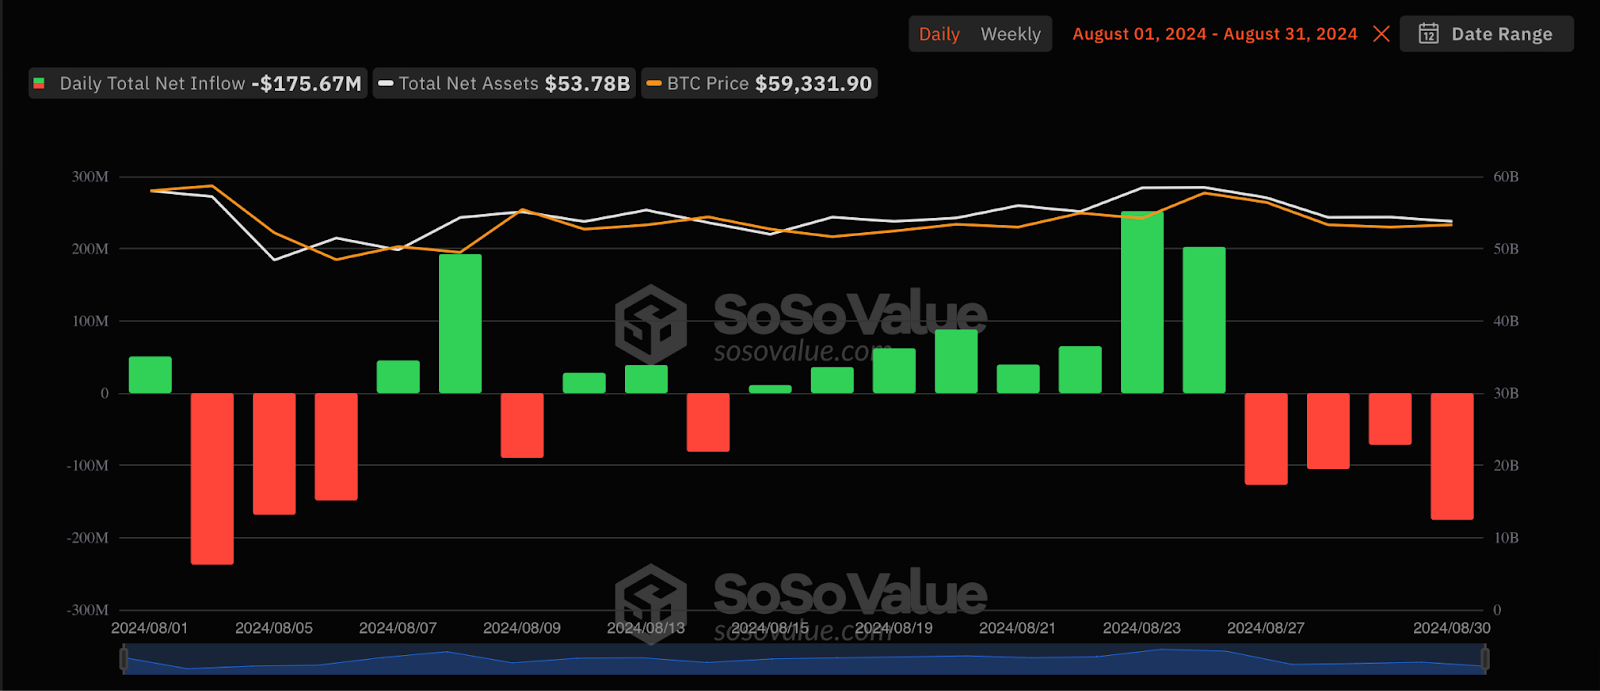
It is worth noting that the total net assets of BTC ETFs at the end of August was $53.78b, which is 8.77% lower compared to the previous month. And the total net outflow from BTC ETFs (Daily Total Net Inflow) on the last day of August was (-) $175.57m.
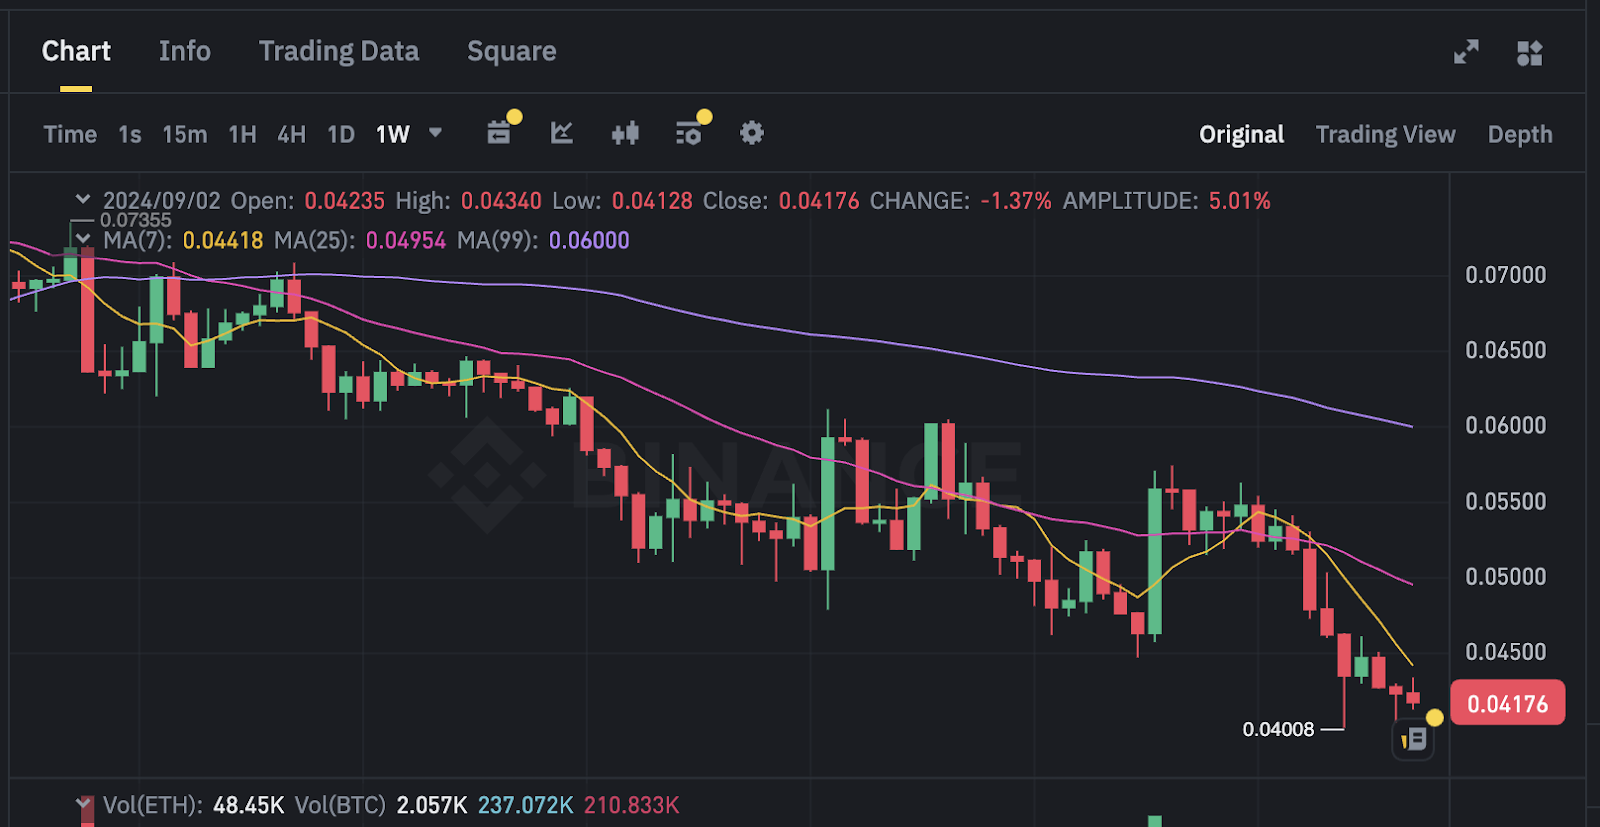
Let's now move on to Ethereum, which looked weaker than BTC in August just like in the previous months of summer. In general there is a downward trend for the ETH|BTC pair (0.4176), which cannot be broken by a strong upward movement. It may take a few more months.
ETH|BTC Pair, Binance
ETH in a pair with USDT broke the lower support line in the region of $2450, falling to $2111 on the decline at the beginning of the month and was unable to recover as quickly as BTC to its previous price levels ($2900 - $3200) by the end of the month. For an upward movement, it is necessary to confidently return above $2,460 and confirm with volumes for purchase. As of the last month of August, ETH is trading at $2513 and looks uncertain.
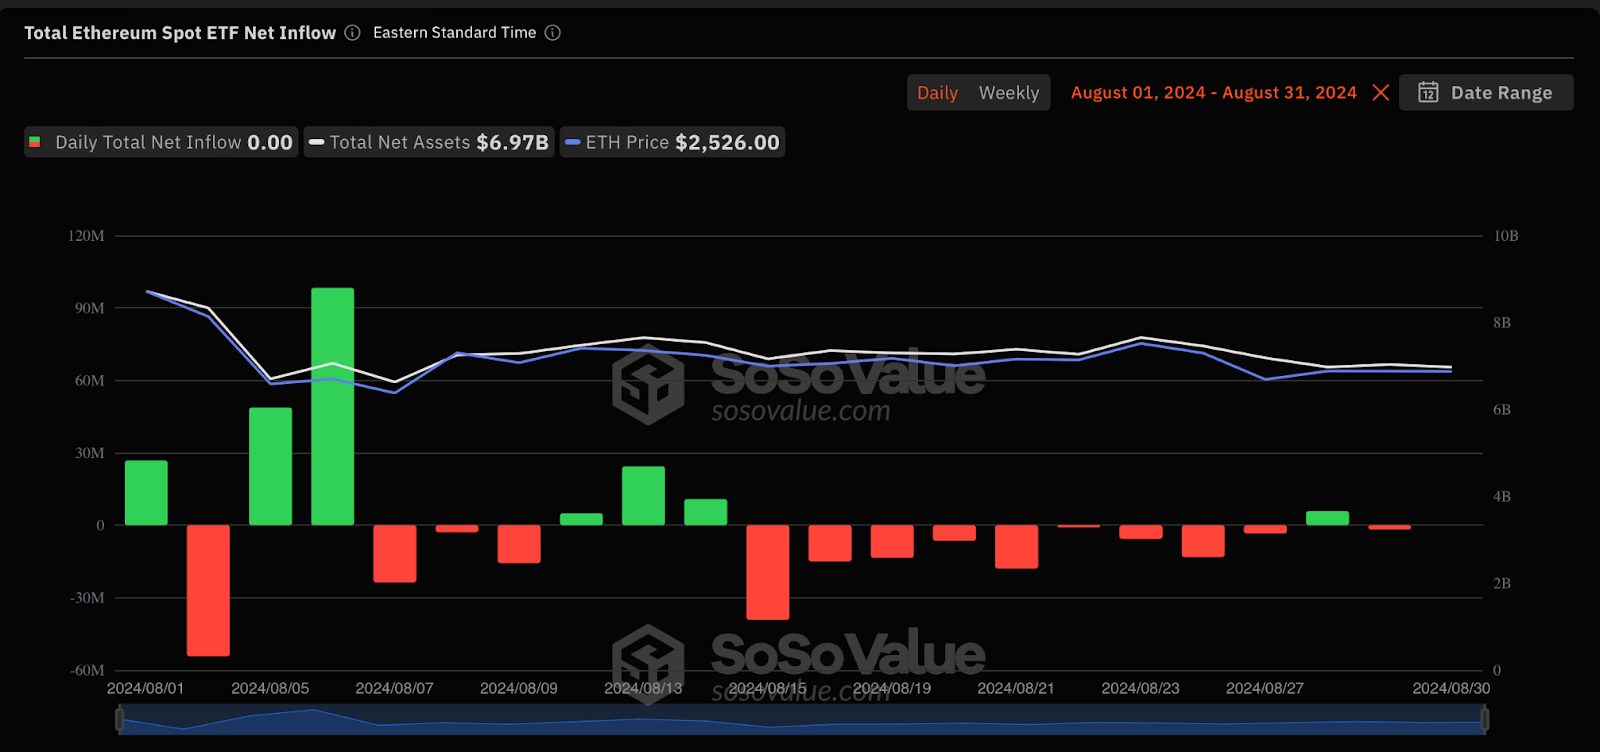
At the same time, the first week of August was the first positive in terms of the inflow of funds into ETH ETFs. At the peak on August 6, Daily Total Net Inflow was $98.3mln. At the end of the month, we can see a lack of interest in ETH ETFs and almost zero Net Inflow with a total asset volume in ETH ETFs of $6.97b.
Solana (SOL) is doing much better against BTC than ETH and is trading at $136 on the last day of the month, having recovered its price by 20% after a strong drop to $110 at the beginning of the month. However, it also has not reached its peak around $180 at the end of July.
Against BTC, Solana is in the range of 0.002 - 0.0026 on higher timeframes, maintaining an ascending structure and being in a local sideways trend. The main hype for Solana came from the Pump Fun platform, which has recently “overheated” in terms of hype and is “cooling down” in terms of trading volumes on it. New triggers are needed for further growth.
Dominance of Bitcoin and Altcoins
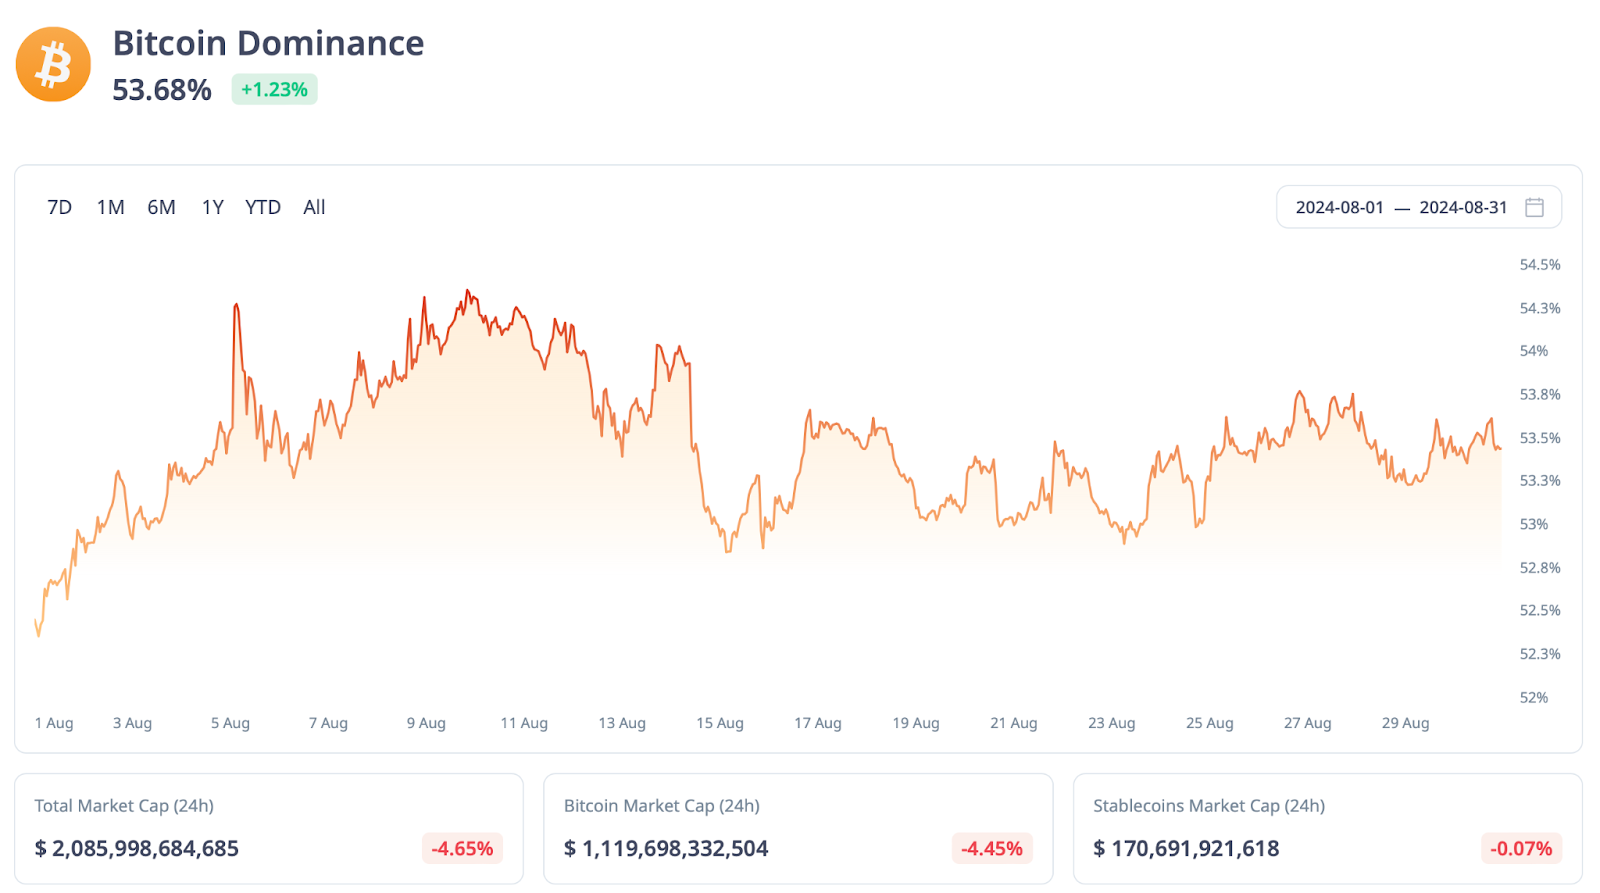
According to Cryptorank, Bitcoin dominance remained at the same high levels in August as in July, slightly decreasing from the beginning of the month to 53.4% at the end of the month. But this is 6% higher than the figures for August last year. Investors are now accumulating and trusting BTC more than altcoins.
On the other hand, some altcoins have shown a significant increase in dominance compared to the beginning of 2024. For example, the dominance of Solana (SOL) has more than tripled over the past six months, rising from 0.78% to 3% at the end of August. Binance Coin also showed a small increase in dominance - from 3.1% to 3.5%.
But not all major assets showed an increase in dominance, for example, the ETH indicator showed a decrease from 18.1% to 14.6%, which reflects a change in market sentiment not in favor of Vitalik Buterin's cryptocurrency. The dominance of the USTD stablecoin decreased from 6.5% to 5.2%, and the share of Ripple (XRP) fell from 2.7% to 1.4%.
Ganers&Loosers
In August, as in every month, we can highlight the assets that showed both the greatest growth and the greatest decline during the month (from the TOP100 on Coinmarketcap).
Among the Ganers, we can highlight the infrastructure project - the Internet of Things (IOT) network Helium on Solana, which showed the maximum growth of 82.89%. SATS, which grew by 65.33% and SUI with a growth of 50.3%.
Among the gainers that hyped up in August, we can highlight AAVE (growth by 42.2%), which is merging with Maker. And of course, TRON (growth by 20%) led by Justin Sun, who launched the SunPump Meme platform for trading meme coins.
On the other hand, the main loser of this month was unexpectedly TONCOIN (TON), which gained crazy momentum and showed significant growth over the past months, losing 11% since the beginning of the month, and more than 20% in one day since the peak of August. All this is connected with the sensational arrest of Pavel Durov in France and serious charges against him. You can see the entire TOP losers for August below in the table (according to Coinmarketcap).
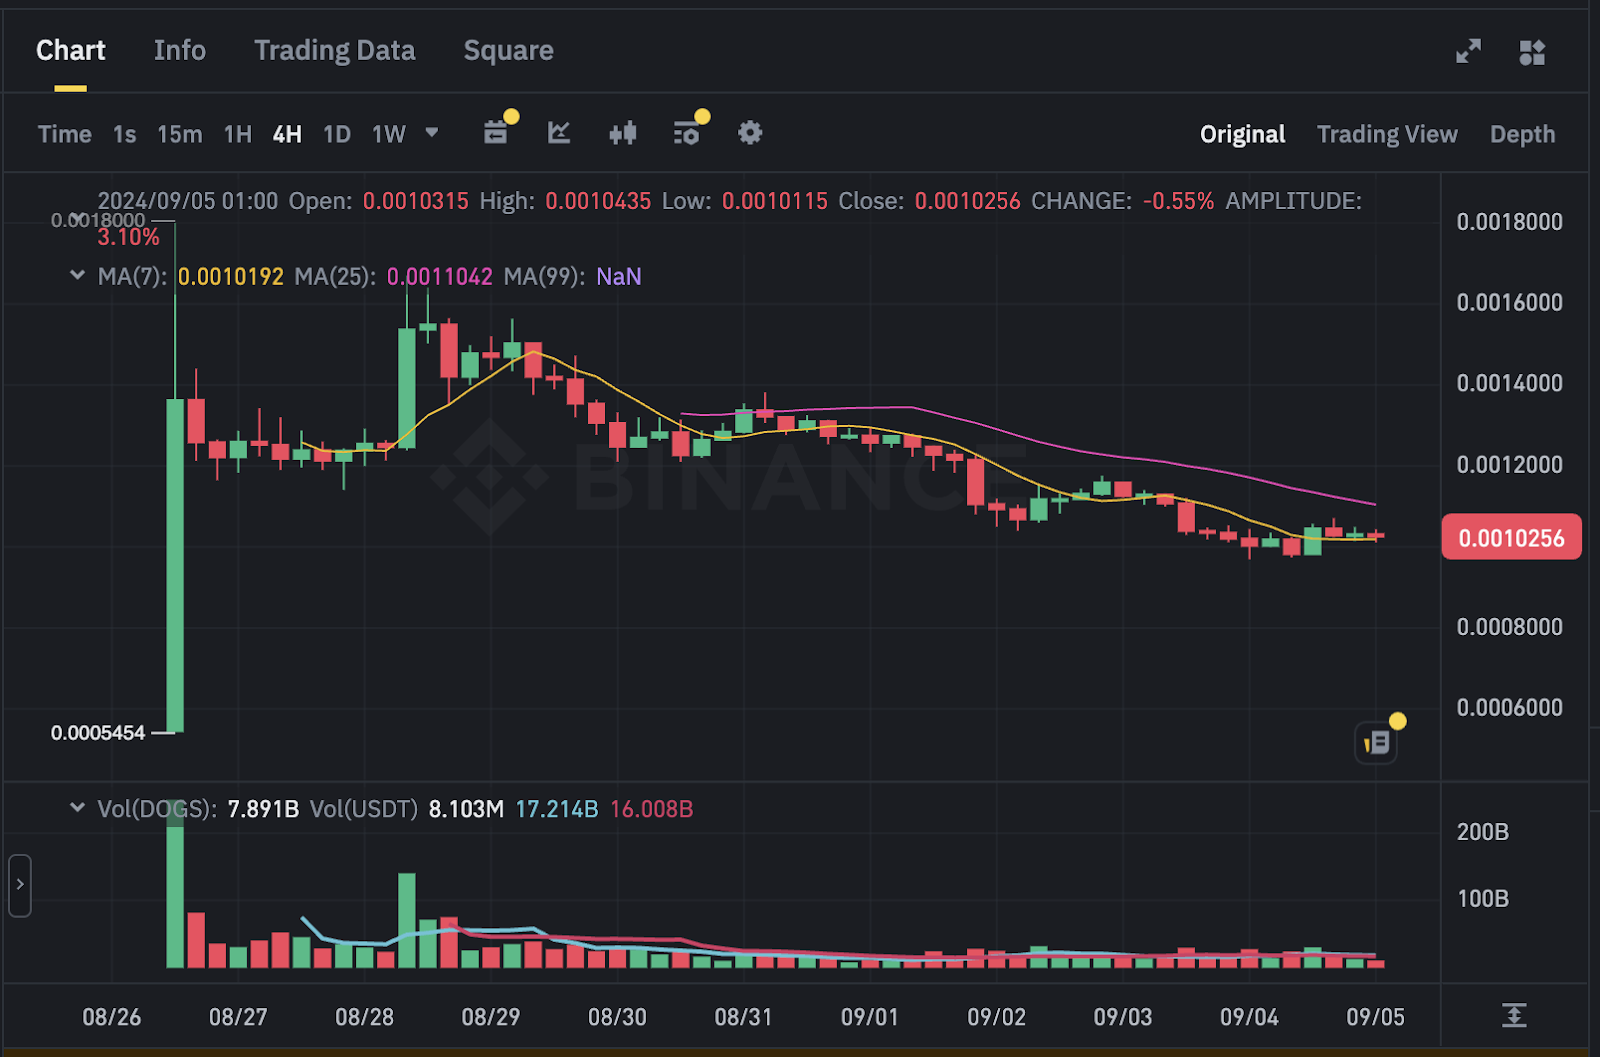
It is worth highlighting the beloved DOGS project, which awarded points for the age of the telegram account and for simple tasks. Having gathered a million-strong audience around itself, DOGS announced its listing on August 26 on all major exchanges (including Binance, OKX, Bybit) and on the first day of trading entered the TOP100 by capitalization (at the peak of about $1 billion) with a daily trading volume included in the TOP15 by market (about $500 million).
Trading Volumes
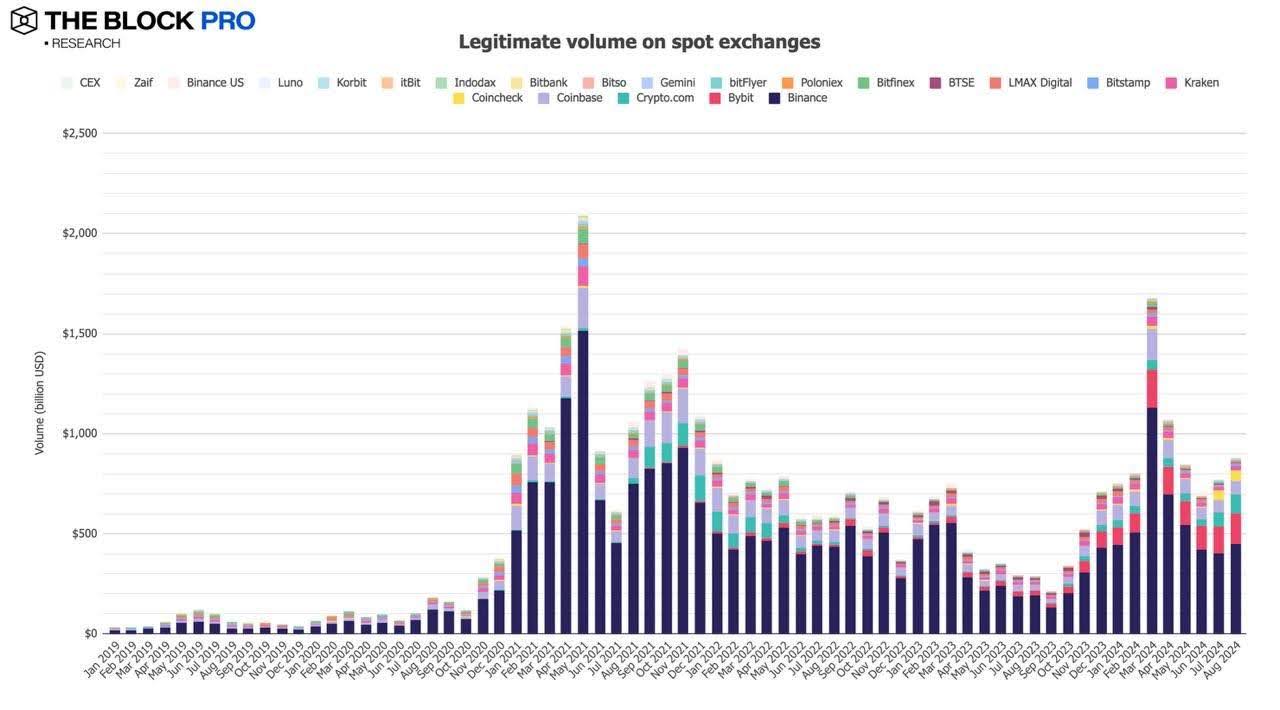
The spot trading volume (Legitimate Volume) on centralized crypto exchanges (CEX) in August was $877.5b, up 13.7% from $760b in July. The increase in trading volume occurred despite the fact that most cryptocurrencies ended the month with losses. Prior to July, spot trading volume on exchanges had been steadily declining since peaking at $1.7b in March.
Total spot trading volume on exchanges in August was $1.2 trillion, up from $1.12 trillion in July, up 6.6%, according to The Block. Spot trading volume on the Binance platform reached $448.45 billion, accounting for 37.06% of the total spot trading market.
The situation in the derivatives market is as follows. The Block portal shows data only on BTC and ETH futures, and their trading volumes on CEX decreased in August. In August, the trading volume of BTC futures fell by 8.33%, to $1.65 trillion, and Ether futures decreased by 8.62%, to $743.86b.

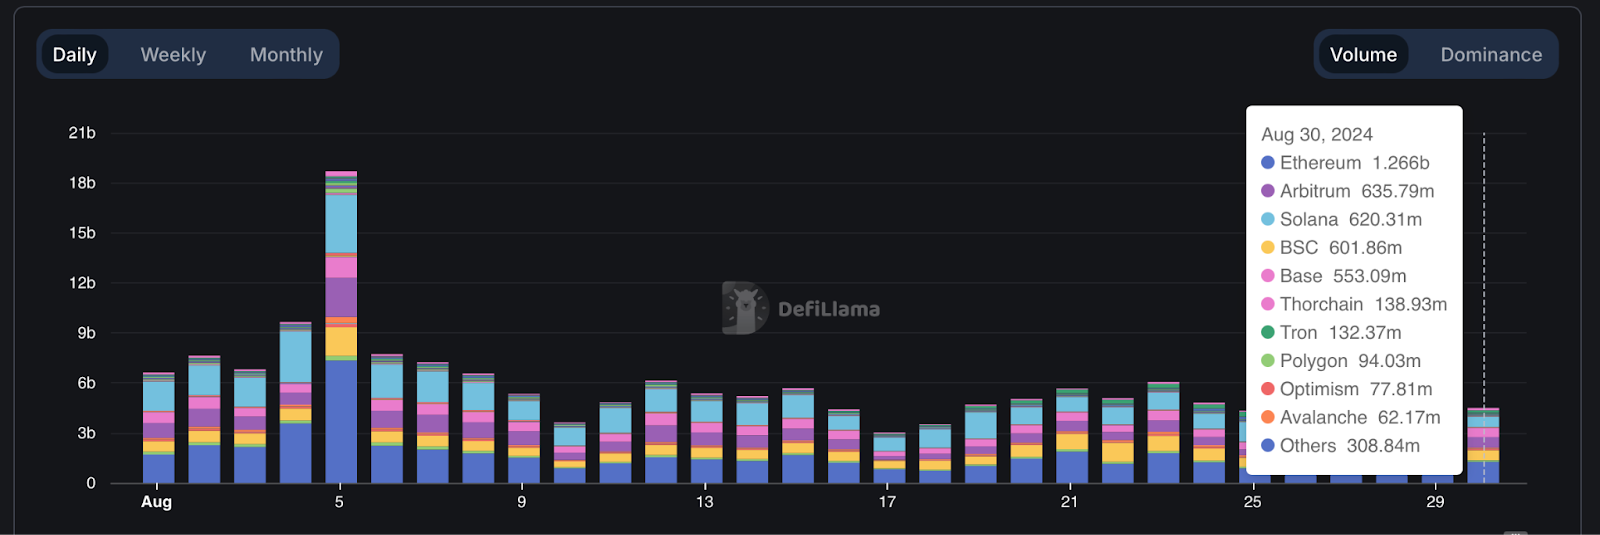
Ethereum, Solana, BSC blockchains led in trading volume on their networks in August, where the championship was occupied by Ethereum, and sometimes Solana. By the end of the month, Arbitrum showed an increase in trading volumes on its network with an indicator of $635.79m and took the 2nd place among the leaders (August 30, 2024). The trading volume on ETH was twice as high as the trading volume of competitors and amounted to $1.266b (as of August 30). According to DefiLama. Of the DEX exchanges themselves, the top three are Uniswap, Pancakeswap, Orca with a daily trading volume in August of $1.5b, $500mln and $350mln, respectively.
State of Layer-2
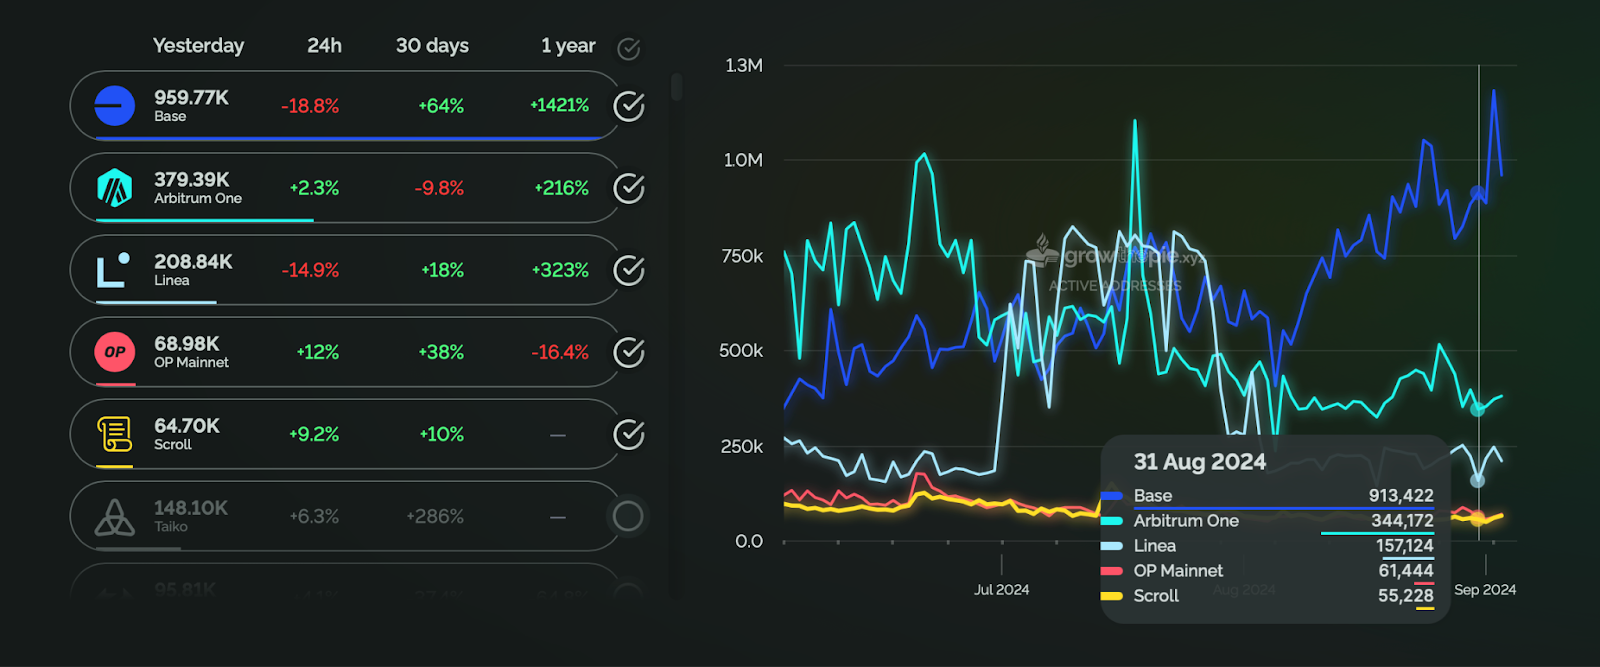
According to Growthepie, as of August 31, the top players in the L2 solutions market by number of active addresses interacting with the networks are Base, Arbitrum One, and Linea. Base has shown incredible growth in August compared to July, with 959.77k active addresses at the time of writing, up 64% over the past 30 days. This growth is due to the launch of the “basenames” service on August 21 on the Ethereum Name Service (ENS) platform. It allows users to create personalized Base.eth usernames associated with their wallet addresses. In the first week, 200,000 unique names were created. Arbitrum One has shown a 9.8% decline over the past 30 days, with an active address base of 379.39k. Linea rounds out the top three with 208.84k active addresses, up 18% over the past 30 days.
The number of distinct addresses that interacted with a chain
Also worth noting is Optimism with a base of 68.98k addresses, which has shown an impressive growth of 38% over the last month and has outpaced Scroll with 64.7k active addresses.
State of DEFI
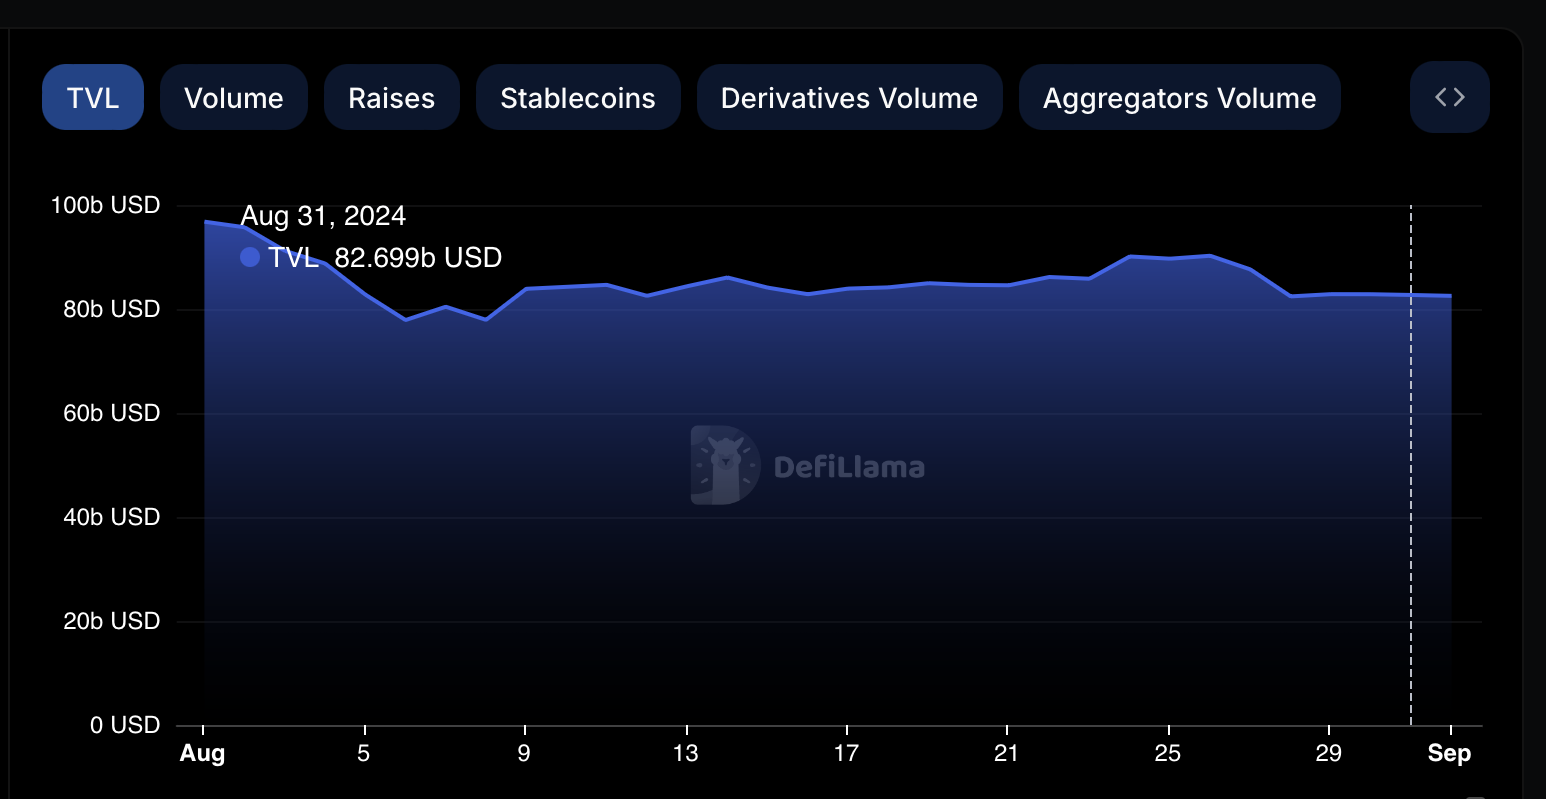
The total value locked (TVL) in DeFi protocols in August was $82.69b, down 18% from July. A possible reason for this decline could be investor concerns about the TON situation and the arrest of Pavel Durov, which saw a strong outflow of TVL from the TON network to DEFI platforms.
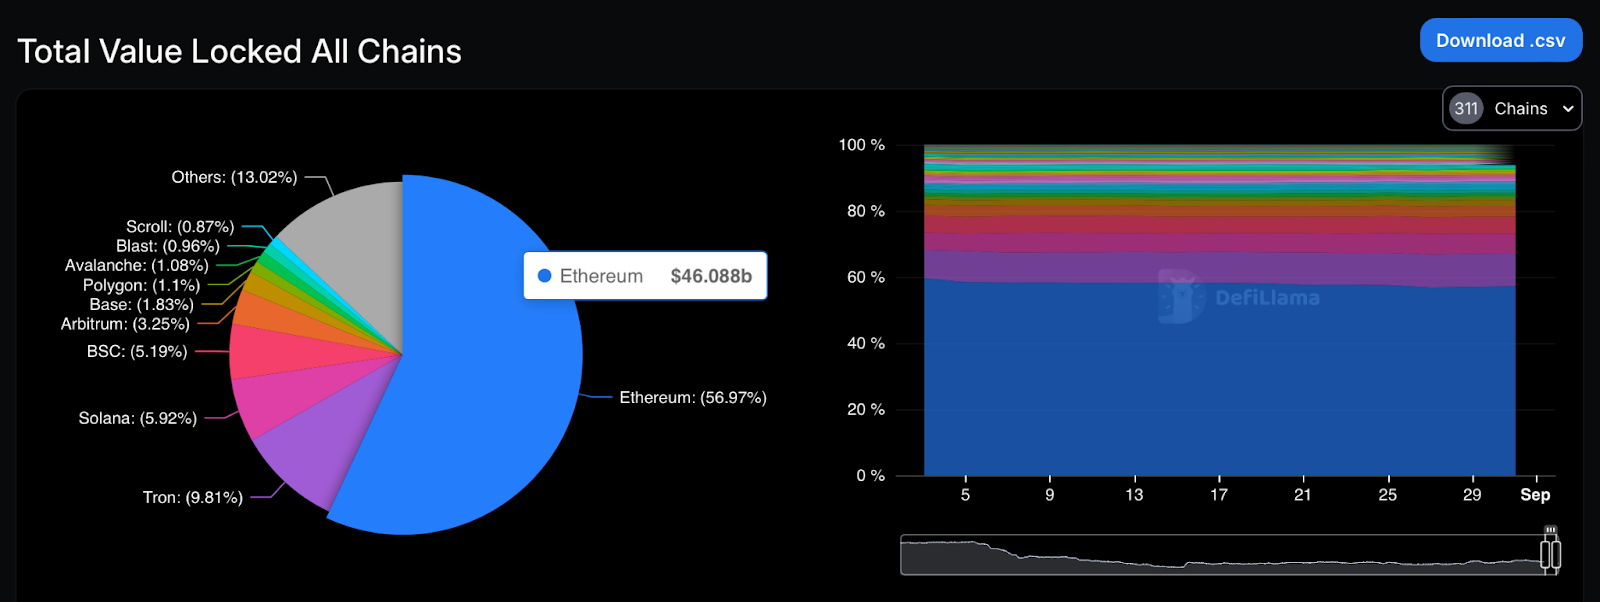
The main leader in TVL is, of course, Ethereum with a share of 56.97% of the entire market and an indicator of $ 46.08b. Among the DEFI platforms built on its network, the main inflow of funds is provided by Lido, Eigenlayer, Aave, Maker, Uniswap. The only change in the position in TVL since July occurred between ether.fy (5th place) and JustLend (6th place), they swapped places.
The second blockchain in TVL on the market is Tron with an indicator of $ 8.11b, occupying 9.81% of the total market share. The main DEFI platforms on the Tron blockchain that provide such a high TVL are JustLend, Juststables, Sunswap. Not long ago, SunPump Meme was launched, which activated an additional inflow of funds into the Tron network.
Solana, which closes the top three, has a TVL of $4.7 billion (5.92% of the total TVL). Jito, Kamino, Jupiter are the main players on the Solana network, providing an influx of funds here. The next TOP3 of the second division are BSC, Arbitrum and Base, which has been showing good performance lately.
Conclusion
After a sharp fall (more than 20%) in early August, BTC was able to restore its price levels from the $50k to $60k region, which cannot be said about other assets on the crypto market. Bitcoin's dominance remains at fairly high levels as before, and ETH has not been able to get out of a protracted decline in a pair with BTC so far. August brought us a lot of news from TOP market players such as TRON and TON, both positive and negative, and was also marked by an outflow of capital at the end of August, causing investors to fear that September will be difficult and no less volatile.
Ahead of us are the following significant events that are worth paying attention to - data on the US labor market, the Trump-Harris debate (early September), data on US consumer inflation, the decision on the rate. Of the positive ones - the Token2049 conference in Singapore and the release of the head of Binance CZ.
From October, you can stock up on popcorn and watch how the chart below works out (in cycles after the halving).
SimpleSwap reminds you that this article is provided for informational purposes only and does not provide investment advice. All purchases and cryptocurrency investments are your own responsibility.

