Ascending Trend Speculative Buying
Key Insights
- Daily chart analysis coupled with MACD and RSI indicators provides a systematic methodology to time entries during uptrends based on reversal signals.
- The crossover and divergence of the MACD lines offers a confirmation tool for trend reversals, while RSI quantifies overbought levels preceding reversals.
- A structured approach of awaiting confirmation signals before entering trades, then quickly cutting losses if the price invalidates the setup, demonstrates robust risk management.
Below is a strategy for speculative buying based on identifying entry points during an ascending trend.
What Is an Ascending Trend
Ascending trend is visually represented by a price crypto chart indicating a pattern characterized by two or more consecutive higher lows, which are connected by a straight line. This pattern typically signals a bullish market sentiment, as each subsequent low is higher than the one preceding it.
While the price movement within an uptrend channel may occasionally breach the parallel lines defining the ascending channel pattern, it often exhibits discernible levels of support and resistance. These levels offer crypto market traders valuable reference points for establishing stop-loss orders and profit targets. A breakout above the upper boundary of an upward channel often signifies a continuation of the upward momentum, whereas a breakdown below the lower boundary may suggest a potential shift in trend direction.
The presence of an upward channel typically denotes a well-defined uptrend. Traders can capitalize on this pattern by engaging in swing trading activities between the established support and resistance levels, or by aligning their trades with breakout or breakdown movements in the crypto market.
How to Analyze Crypto Charts
Crypto chart serves as a visual depiction illustrating the fluctuations in asset prices over a specific duration. These crypto charts utilize various formats such as line graphs, bar graphs, or candlestick charts to present the dynamic shifts in prices. By analyzing these cryptocharts, traders and investors gain insights into historical trends, patterns, and significant price levels in a convenient manner.
In the late 19th century, Charles Dow, an economist renowned for founding the Wall Street Journal and creating the Dow Jones Industrial Average, identified recurring patterns and trends in stock price movements. This led to the formulation of Dow Theory, a fundamental framework for understanding traditional and crypto market behavior.
The fundamental and crucial for crypto analysis tenets of Dow Theory include the notion that asset prices reflect all available information, the recognition of repetitive historical patterns, and the acknowledgment of the directional nature of price movements.
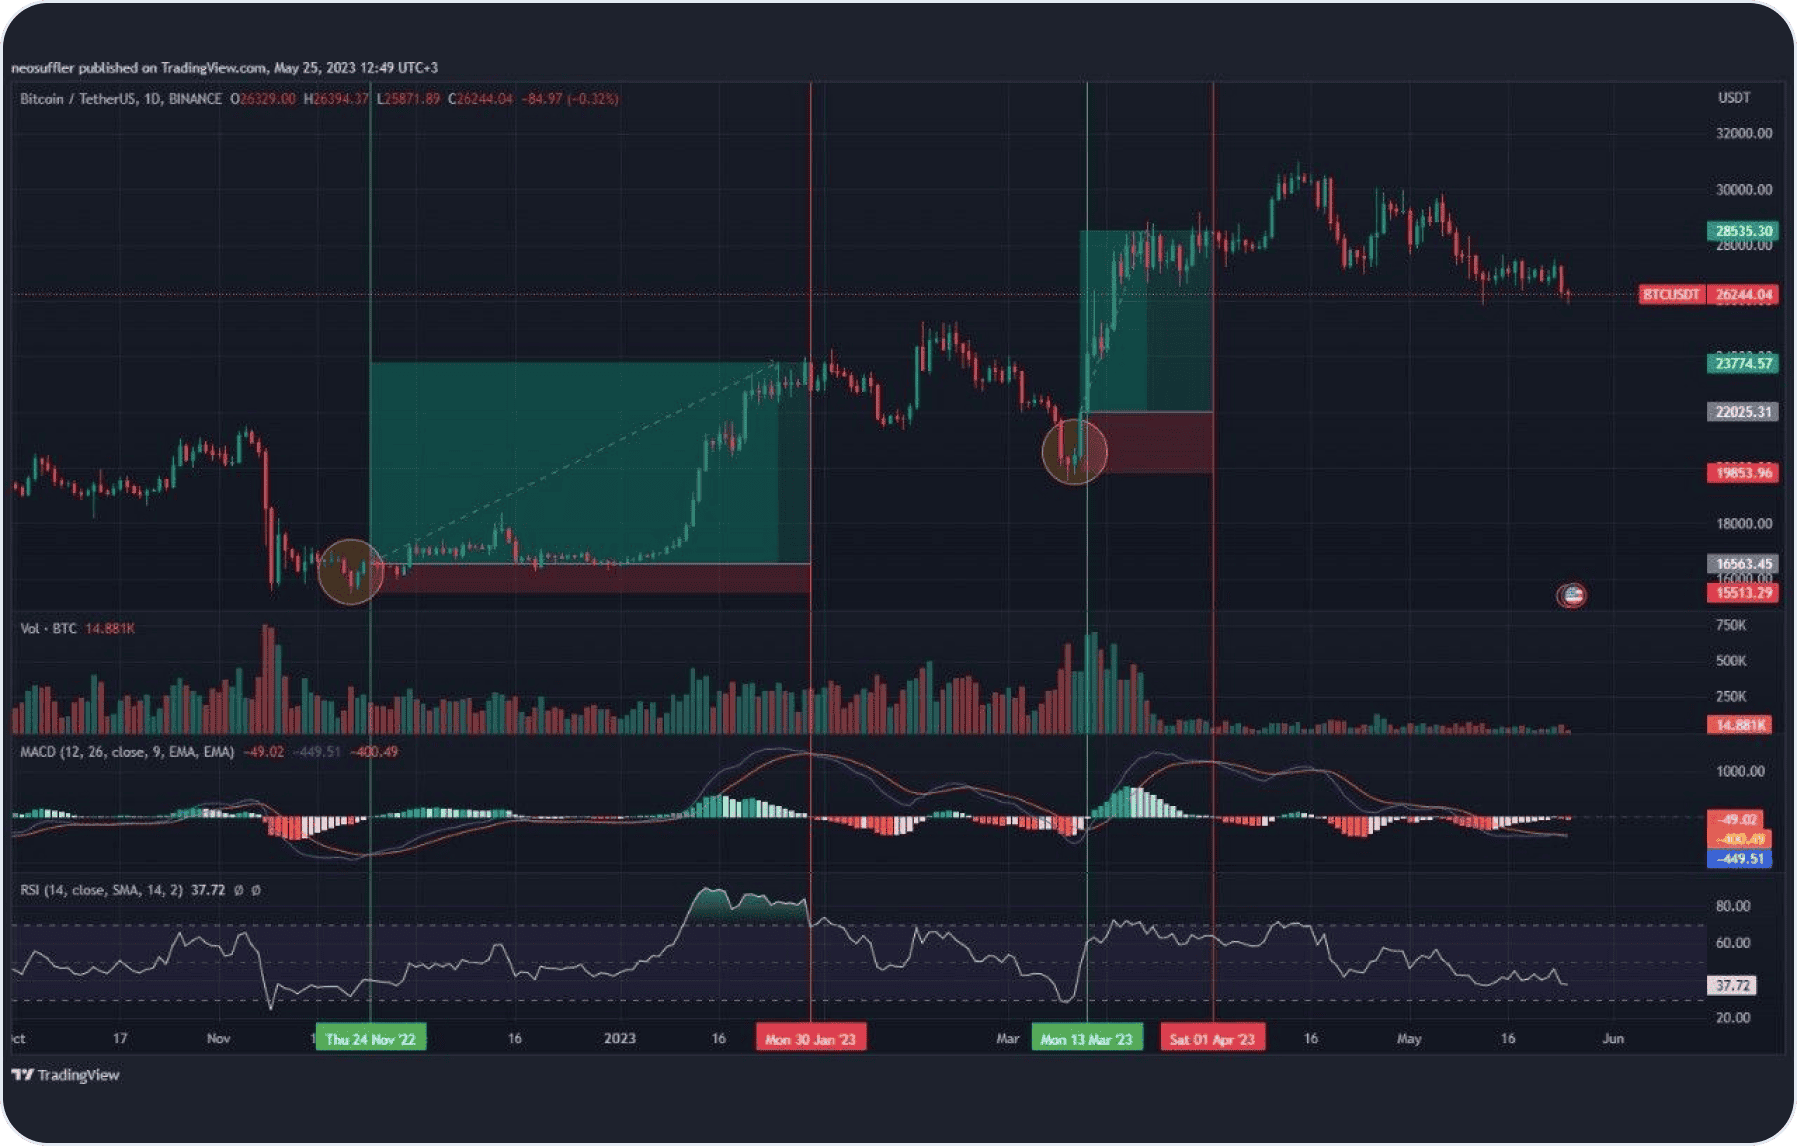
Daily Chart Analysis
Using a daily chart provides a long term perspective on the crypto market. Each candle on a daily chart represents price activity for one trading day. This time frame can be useful for traders who prefer long-term crypto strategy or who are unable to follow the market in real time.
Carefully analyze the daily chart and pay attention to possible reversal formations or patterns indicating a change in the direction of the local trend.
What Is MACD Indicator
Momentum indicators that signal potential trend reversals are crucial tools in market analysis, aiding traders in detecting shifts in trend strength or direction. Among these, the MACD (Moving Average Convergence Divergence) stands out as one of the most popular.
The MACD derives from the disparity between two moving averages, typically exponential ones, and typically comprises two lines:
- MACD Line
This represents the variance between the fast (short-term) and slow (long-term) exponential moving averages, portraying the dynamics of crypto market price shifts and facilitating trend direction and strength assessment.
- Signal Line
Serving as a moving average (usually exponential) on the MACD line, it smoothens the MACD line and serves as a signal for entry or exit positions.
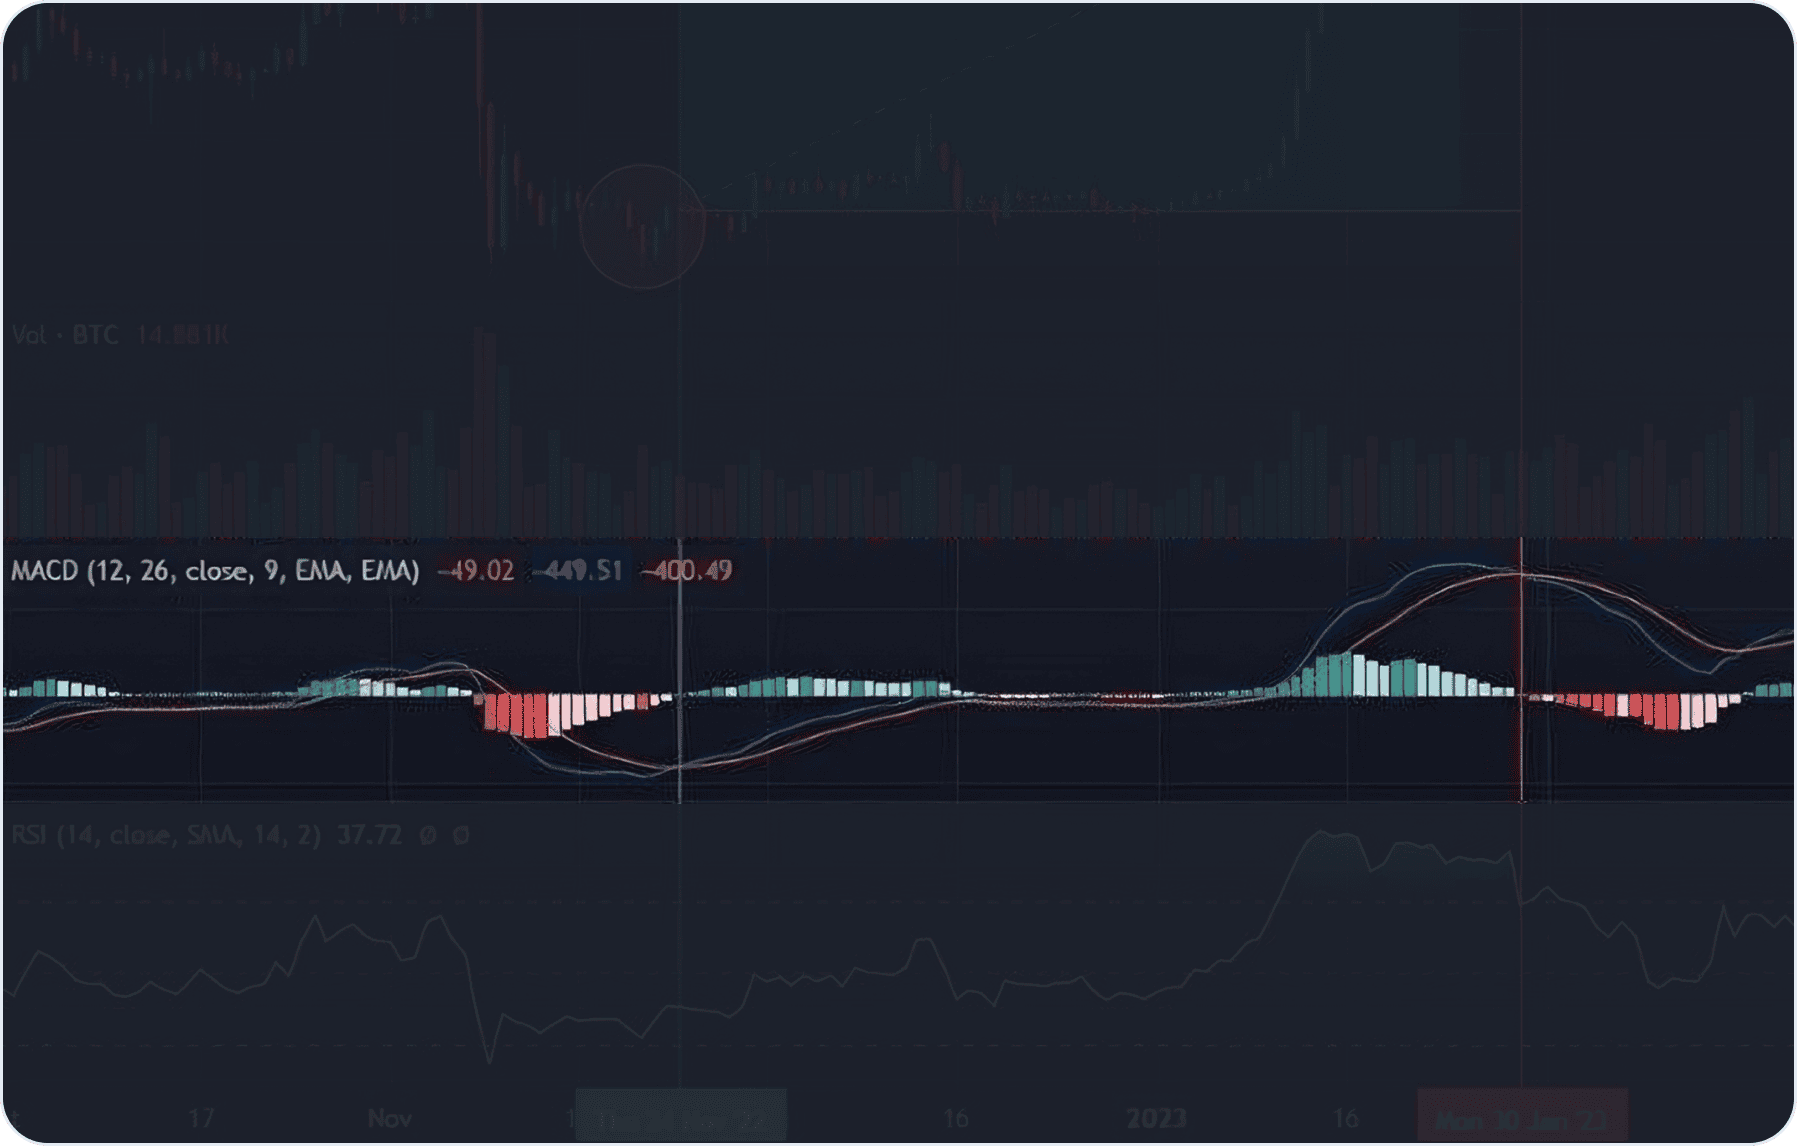
The MACD is one of the commonly used indicators that helps confirm price reversals. When the blue line crosses above the orange line and remains above it, this is considered a confirmation of a reversal.
What Is RSI Indicator
The RSI (Relative Strength Index) can provide further validation of the intensity of a trend. When prices ascend and the RSI performs heightened (yet doesn't surpass overbought thresholds), it can bolster trust in the upward trend.
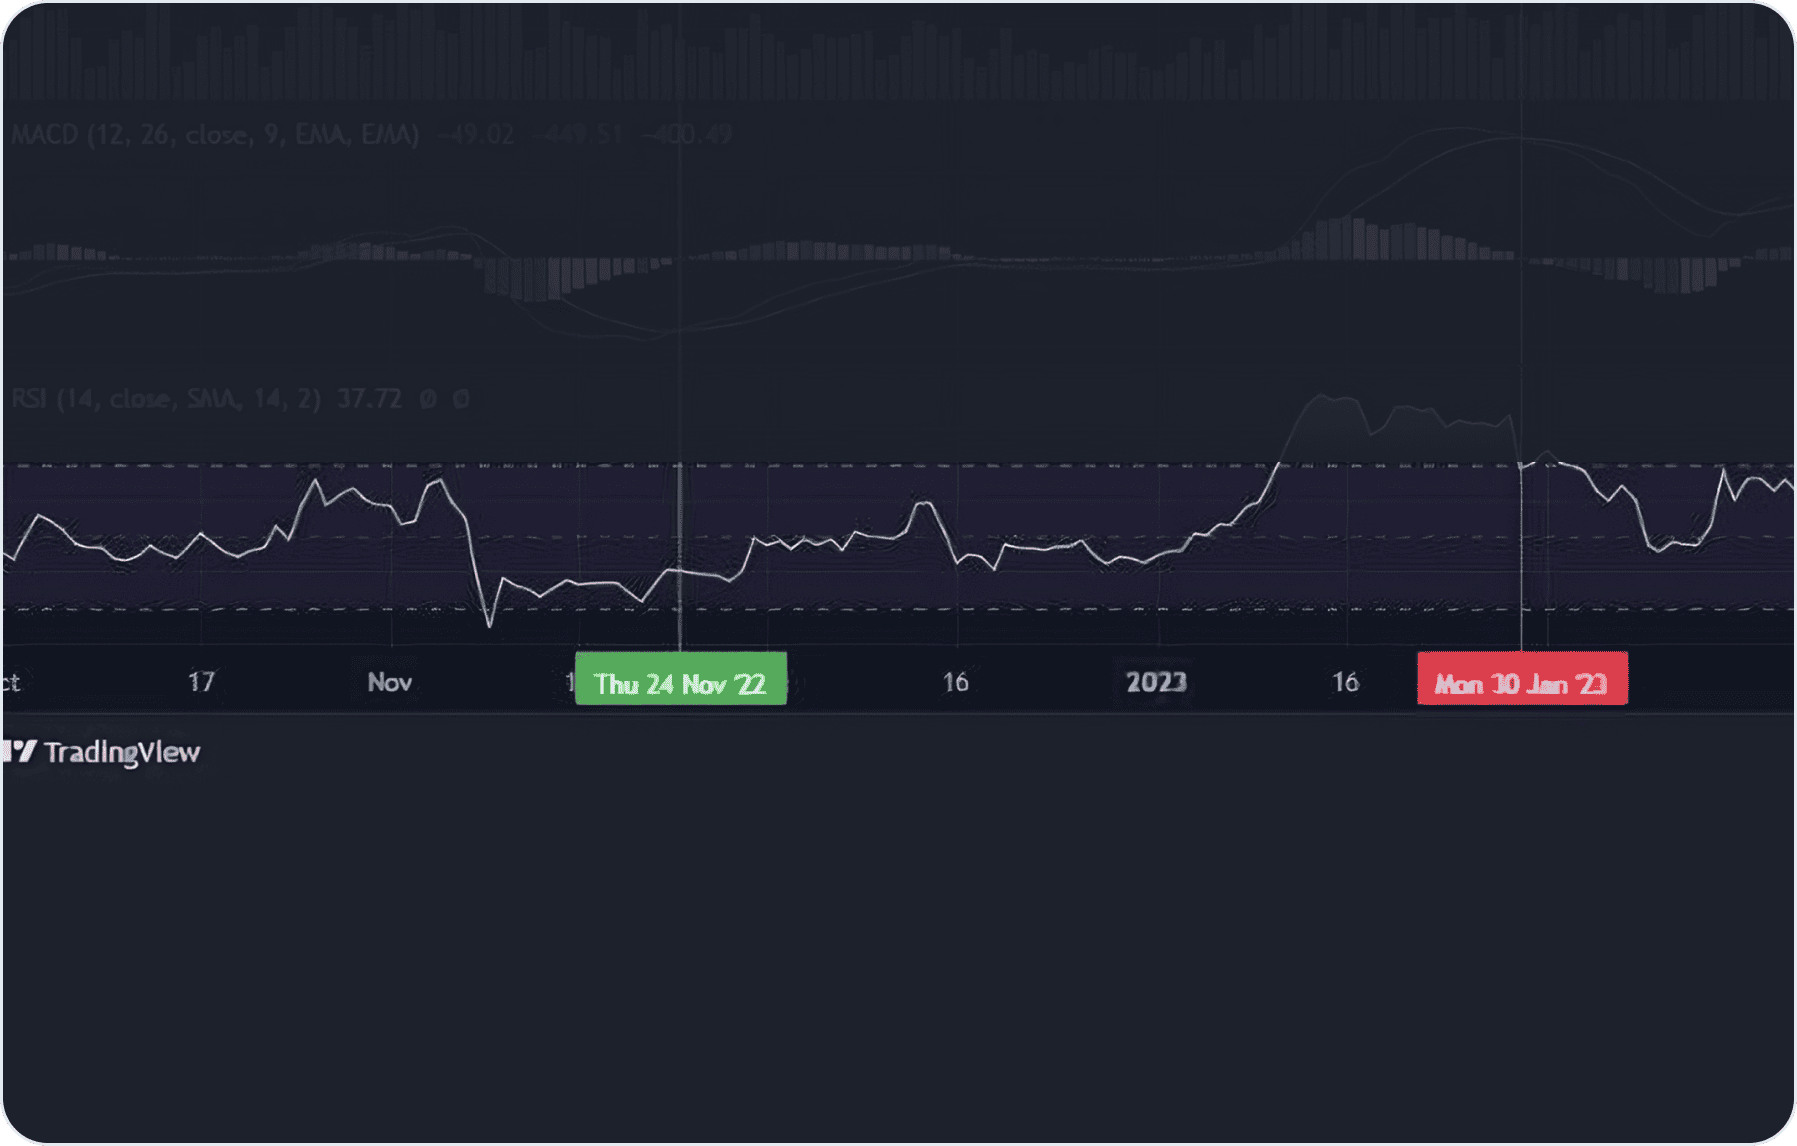
It’s important for crypto market participants to be vigilant for disparities between the RSI and price movements, like a downward disparity during a robust upward trend, which may signal a potential shift in direction.
Traders utilize the RSI channel indicator to pinpoint potential points of support and resistance for initiating or concluding trades. A viable crypto strategy in trading based on channels involves recognizing the limits outlined on the chart and executing trades within those parameters.
RSI values range from 0 to 100, and values below 30 usually indicate an overbought market condition, which can be a signal for price reversal.
How To Further Use Crypto Charts
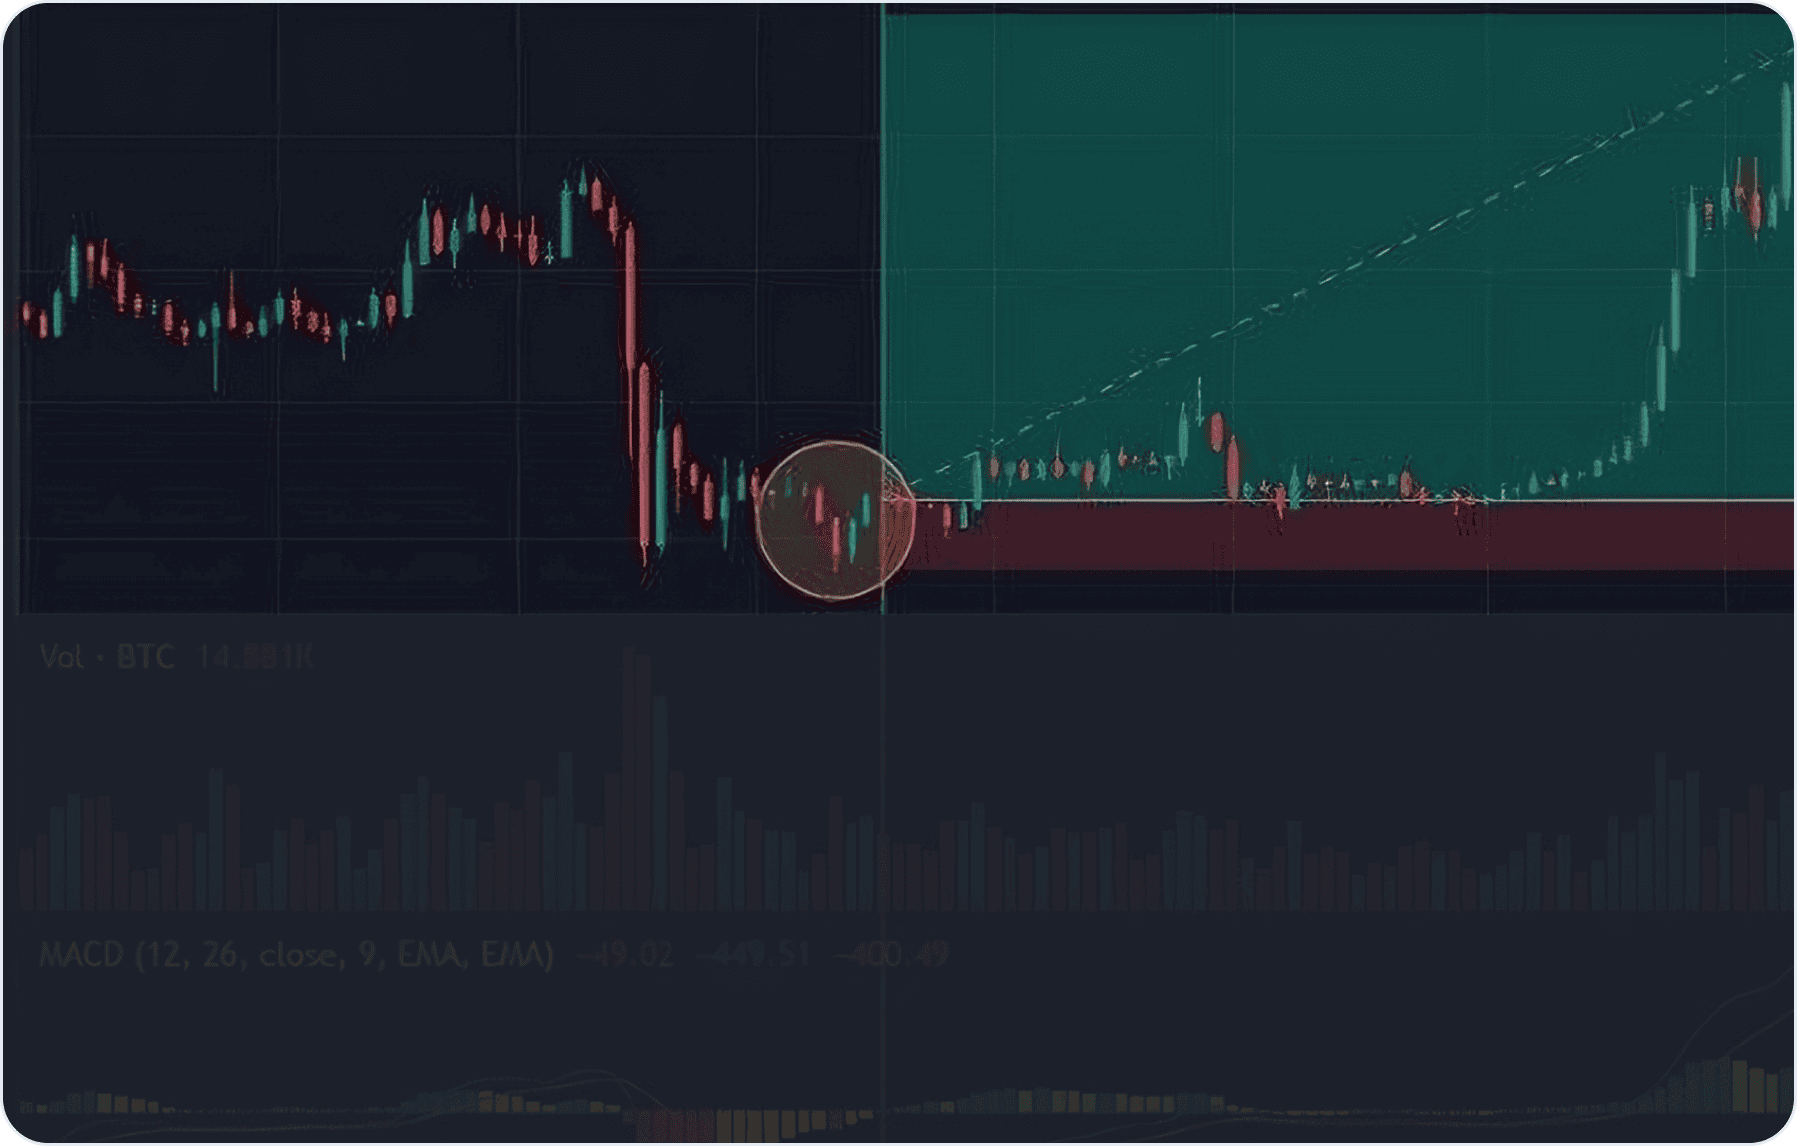
- Skipping a portion of the movement
To ensure confirmation of a price reversal, it is recommended to skip a portion of the movement before entering a position. This helps ensure that the crypto market trend is indeed changing, and support is being formed.
- Entering a position
When the blue MACD line crosses above the orange line and remains above it, providing confirmation of a reversal, and the RSI indicates market overbought conditions, speculative buying position can be considered.
- Exiting a position
When the orange MACD line crosses above the blue line and remains above it, providing confirmation of the completion of the ascending wave, and the RSI indicates market overbought conditions, considering exiting the position to lock in profits.
Crypto Strategy: Risk Management
In case the price starts moving in the opposite direction and drops below the reversal point on a crypto chart, it is recommended to take measures to limit the risk and exit the position to minimize potential losses.
The strategy for speculative buying based on the analysis of the daily chart using MACD and RSI indicators offers entry points during an ascending trend.
Confirmation of a price reversal occurs when the blue MACD line crosses above the orange line and remains above it, while the RSI indicates market overbought conditions.
эта и другие стратегии проверены и используются нашим симплсвоп аналитиком, вот увидьте, какие торговые сценарии можно формировать с этой стратегией”
This crypto strategy, among others, is proven trustworthy by SimpleSwap analyst. You can see on TradingView how to form a trading scenario using the strategy at hand.
Users can get crypto assets to test this strategy on SimpleSwap.
Summary
The crypto strategy above provides a framework for speculative buying, focusing on identifying entry points amid an ascending trend.
Within this trend, traders can utilize the ascending channel pattern, which delineates discernible levels of support and resistance. Breakouts above the upper boundary signal a continuation of the uptrend, while breakdowns below the lower boundary may suggest a potential trend reversal.
Daily chart analysis offers a long-term perspective, with each candle representing one trading day. Traders can leverage indicators like the MACD and RSI to confirm price reversals and gauge trend strength. The MACD, derived from two moving averages, and the RSI, which measures the intensity of a trend, are particularly useful in this regard.
Risk management is essential, with traders advised to exit positions if prices move against them to limit potential losses.
The information in this article is not a piece of financial advice or any other advice of any kind. The reader should be aware of the risks involved in trading cryptocurrencies and make their own informed decisions. SimpleSwap is not responsible for any losses incurred due to such risks. For details, please see our Terms of Service.


