Stock Market & Crypto Indexes Correlation
Key Insights
- Bitcoin shows little correlation with major US stock indexes, moving independently.
- Bitcoin is highly correlated to the Chinese stock market as seen by its correlation with SSE Composite index, implying shared drivers.
- The high 0.82 correlation coefficient indicates a statistical relationship between Bitcoin and the SSE Composite prices.
This article provides an insightful analysis of the correlations between major crypto market and traditional stock market indexes.
Examining these relationships through correlation charts offers a data-driven look at how crypto performs against traditional stocks.
Also, a correlation graph between BTC and the Shanghai Stock Exchange SSE Composite index reflects the degree of relationship between these two assets, and is showcased in this article.
Sharpe Ratio and Sortino Ratio metrics give an insight into further correlation with respect to risk and return.
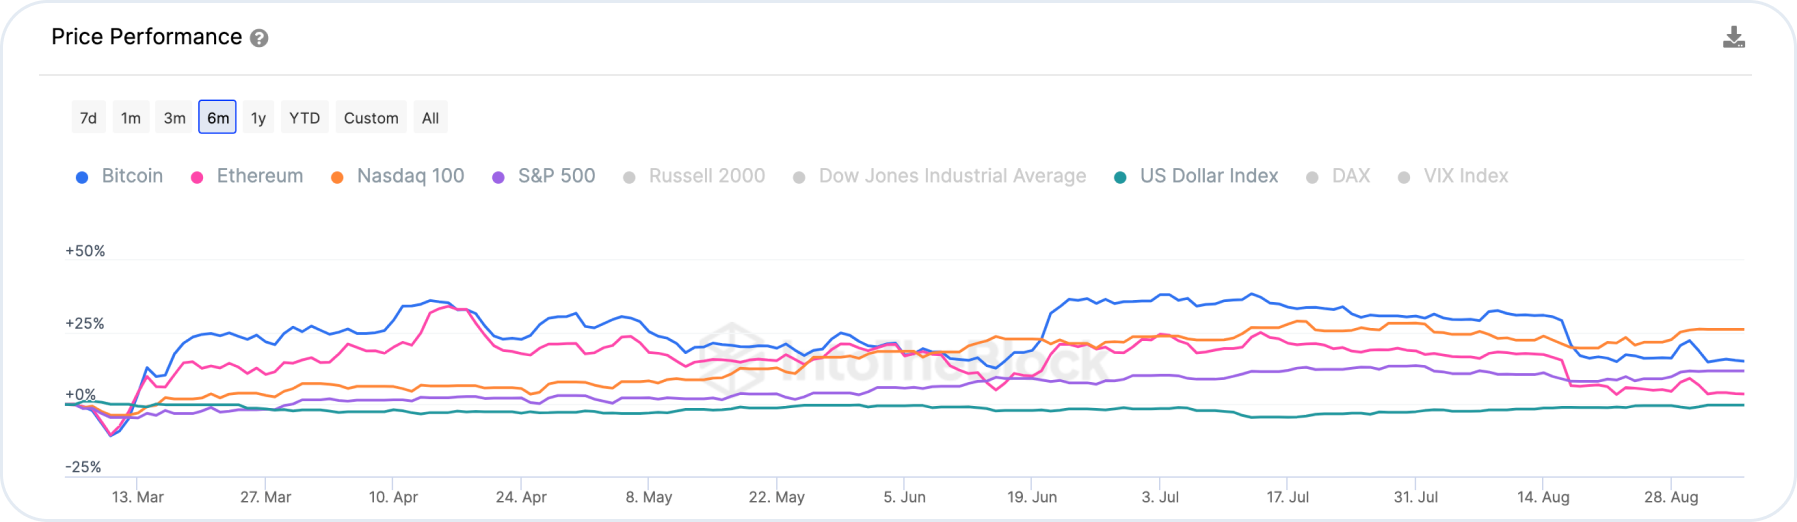
Crypto Assets & U.S. Stock Market Indexes Correlation
A graph of the indexes correlation between BTC and ETH and leading US stock market indexes such as the Nasdaq 100, S&P 500 and U.S. Dollar Index over the past 30 days shows a very low degree of connection, in some cases negative.
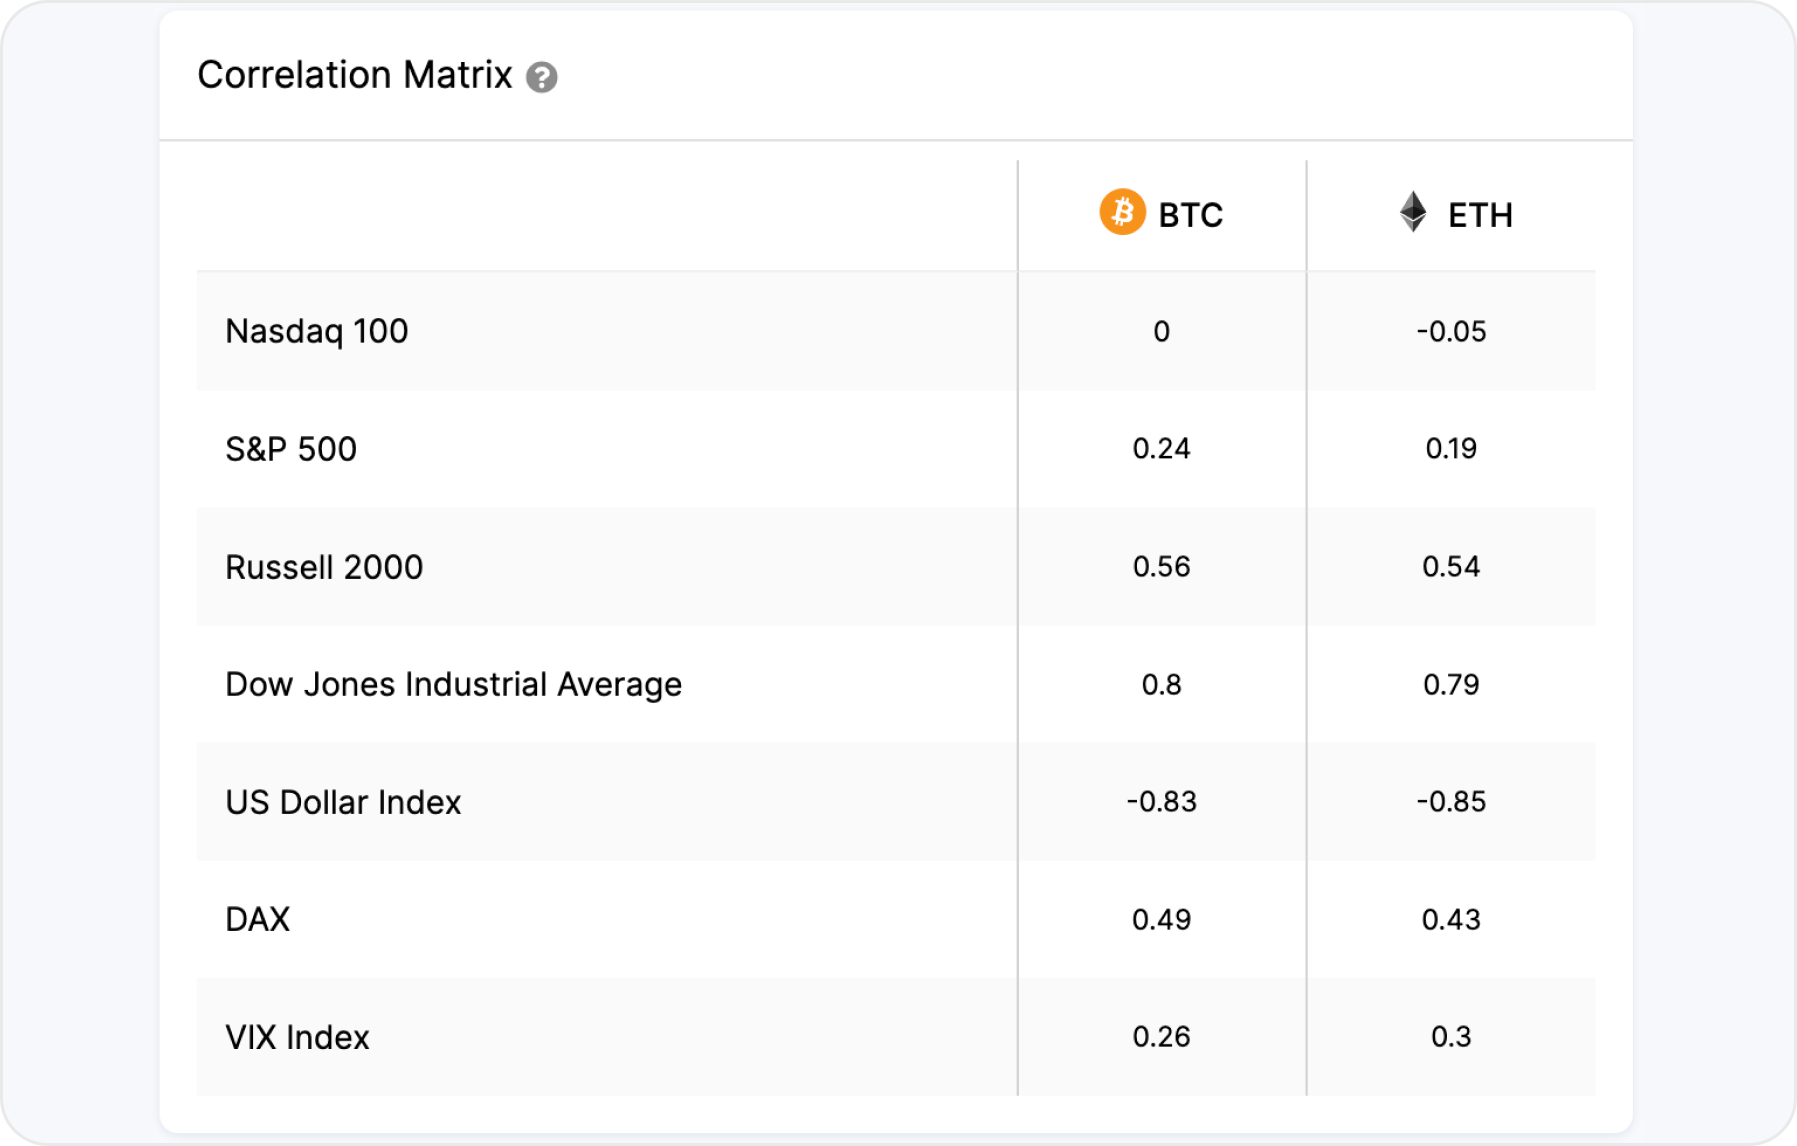
This means that changes in the price of Bitcoin don’t have a strong relationship with the price movements of the mentioned stock indexes. In this context, the low correlation may indicate that the factors affecting the price of Bitcoin are less dependent on the events or drivers of these indexes.
However, it’s worth noting that Bitcoin is currently highly correlated with the Chinese stock market. This means that changes in the price of Bitcoin are more closely related to price movements in the Chinese stock market.
This correlation between crypto index and traditional stock market indexes can be the result of various factors including news, regulations, and investment activity in China.
BTC & the Shanghai Stock Exchange Composite Index Correlation
What Is SSE Composite Index
The SSE Composite Index, introduced on July 15, 1991, is the inaugural index representing the entire Shanghai securities market. This index includes all listed A-shares and B-shares on the SSE Composite Index and is calculated based on the total market capitalization of these stocks.
It embodies the 20-year evolution of China's capital markets and is the most frequently referenced index in China's securities market.
In June 2002, the original SSE 30 Index underwent restructuring and was renamed the SSE 180 Index. The SSE 180 Index comprises 180 of the most representative stocks listed on the SSE, selected based on sector representation, size, and liquidity.
SSE Composite index aims to reflect the overall status and performance of the Shanghai securities market, serving as a performance benchmark for prominent blue-chip stocks and as an underlying instrument for financial derivatives.
Bitcoin & SSE Composite Index Correlation
If Bitcoin has a decent interrelation with the price movement of the SSE Composite index (which reflects the state of the world's second largest economy), it may indicate a similar direction of price movement.
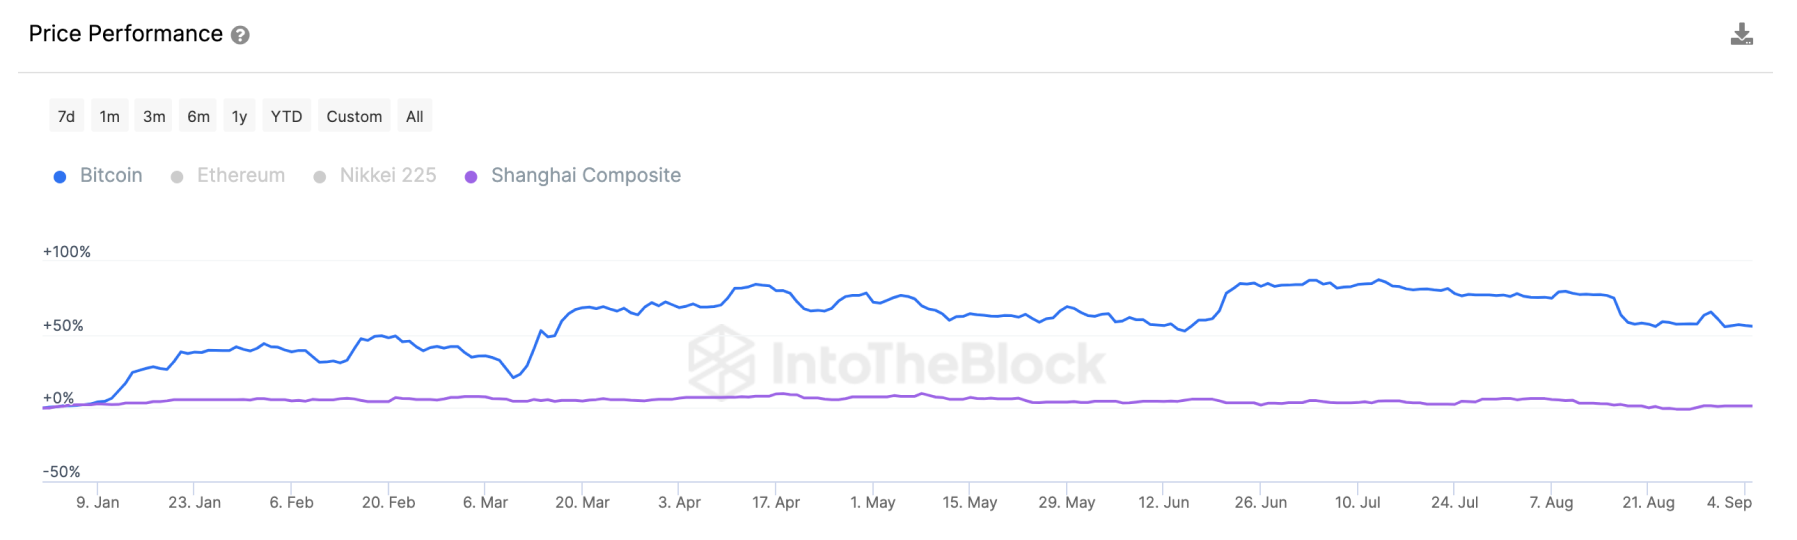
Thus, the positive correlation between Bitcoin and the SSE Composite may be of interest as it may suggest that there is a statistical relationship between these assets.
External factors like global financial events and stock market volatility may influence both assets and contribute to a positive correlation. Economic events and factors in China such as changes in GDP, inflation, trade policies, and others may also influence market conditions and investment activity.
Chinese investors and companies may show interest in cryptocurrencies as a means of investment and portfolio diversification, and this interest may affect the price of Bitcoin.
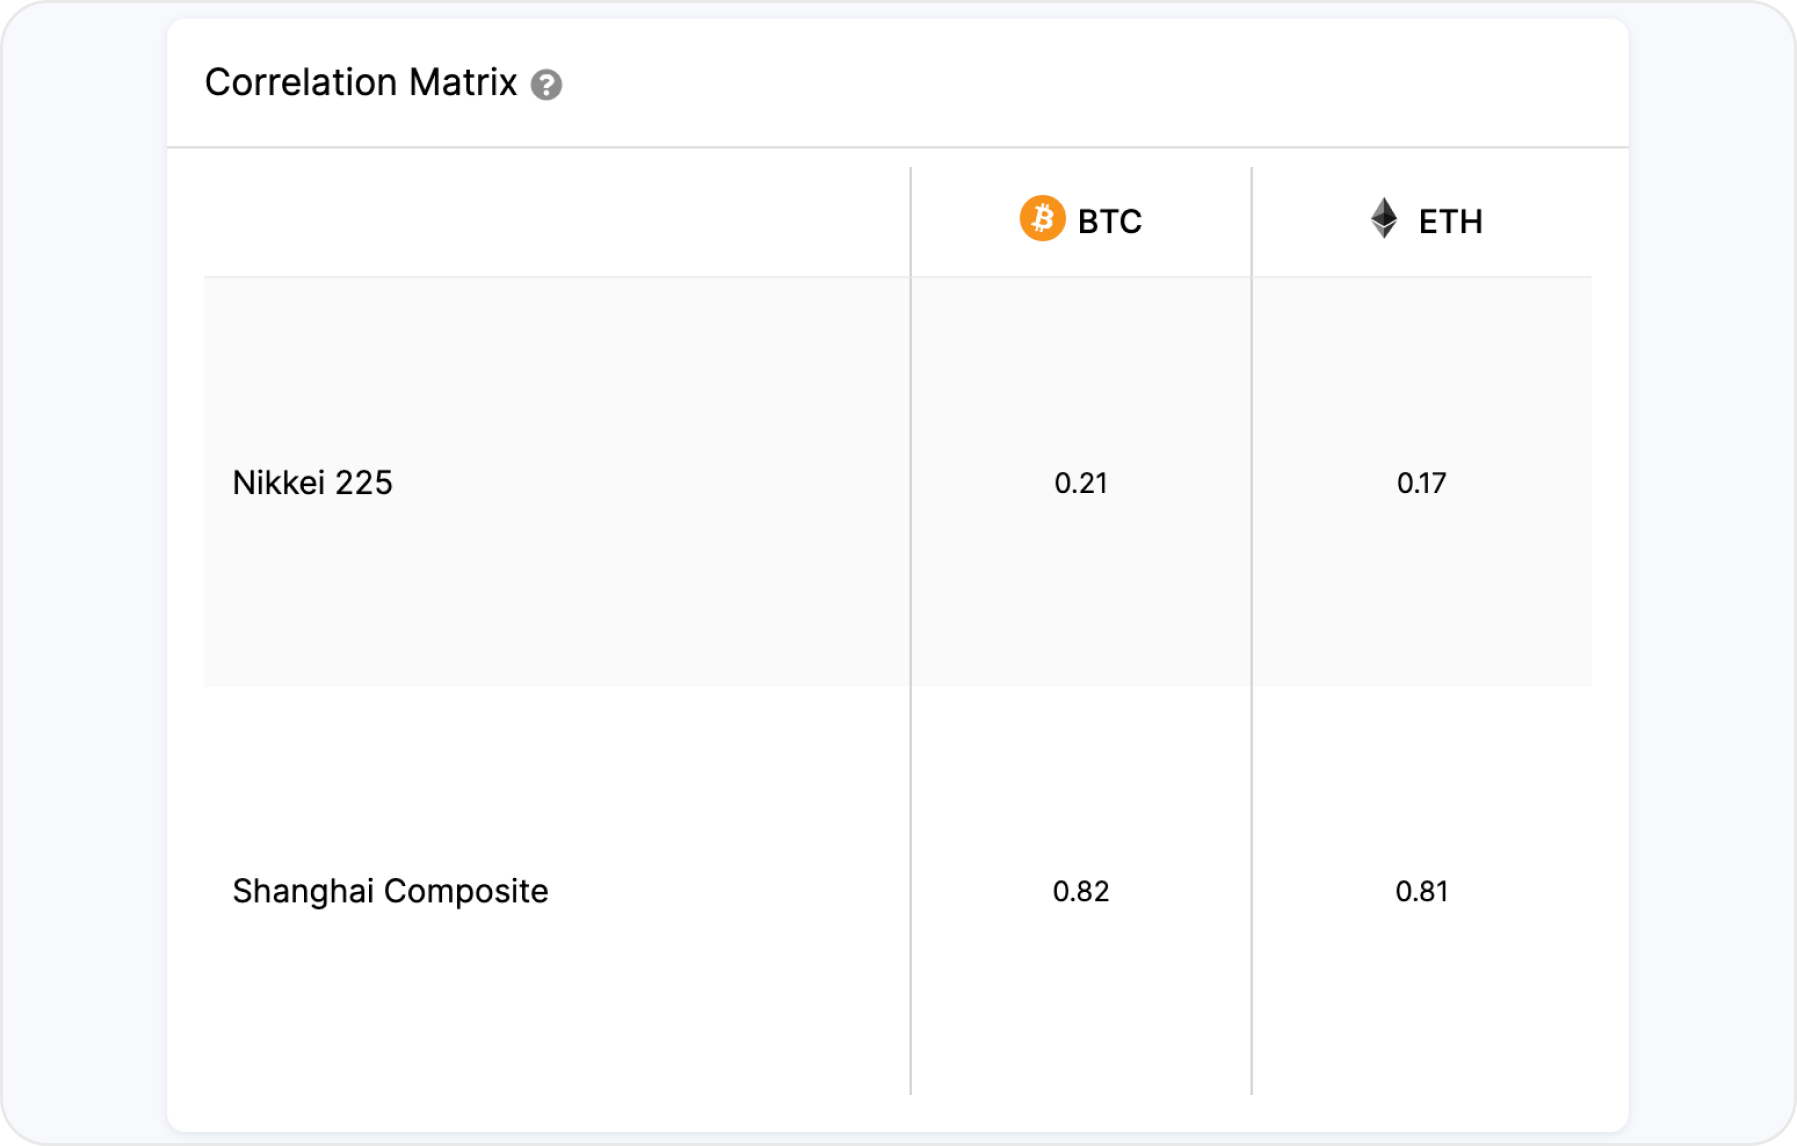
The correlation coefficient, which measures the degree of statistical relationship between the value of Bitcoin and the SSE Composite index, is 0.82. This significance implies that changes in SSE Composite and Bitcoin often go in the same direction.
In other words, when SSE Composite prices rise, Bitcoin values is also more likely to rise, and vice versa. This may indicate this certain statistical correlation between the two assets.
Indexes Correlation: Sharpe Ratio & Sortino Ratio Metrics
Over the past 30 days, assets are correlated with respect to risk and return.
What Is Sharpe Ratio
The Sharpe Ratio is a metric used to assess the performance of an investment relative to its risk. It is calculated by dividing the return on an asset by its volatility.
A higher Sharpe Ratio indicates a more favorable ratio of an asset's return to its risk.
The Sharpe Ratio metric for Bitcoin is -0.21, while for the SSE Composite, it is -0.22. These values are below zero and indicate a poor correlation between risk and expected return over the past 30 days.
In this case, the correlation coefficient of 0.82 between the value of BTC and the SSE Composite index implies that changes in SSE Composite Index and the price of Bitcoin often move in the same direction.
Another example of the usage of Sharpe Ratio is what it shows for S&P 500 index. If the Sharpe Ratio of Bitcoin is higher than that of the S&P 500, it may indicate that investing in Bitcoin yields a higher return relative to risk than investing in the S&P 500. This could be an enticing signal for the investors.
Investors typically seek a positive Sharpe Ratio because it means they receive a higher expected return for every unit of risk they take.
What Is Sortino Ratio
The Sortino Ratio is another measure of investment performance, similar to the Sharpe Ratio. However, it only considers negative fluctuations in the asset price, which is a more accurate reflection of the risk associated with losses.
Consequently, it is a more conservative measure of investment performance than the Sharpe Ratio.
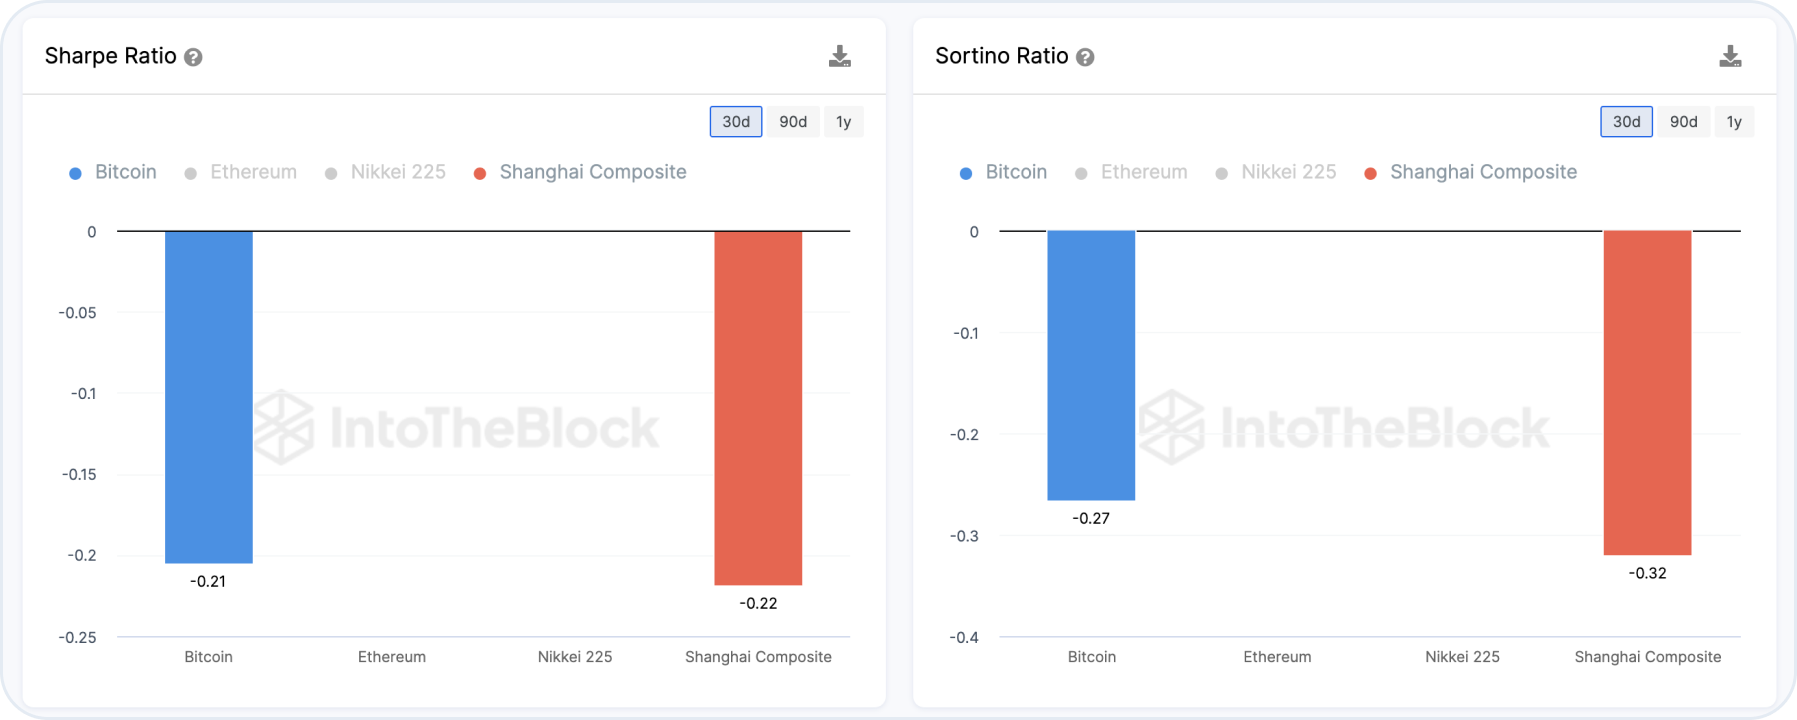
The Sortino Ratio metric, which is similar to Sharpe Ratio but pays more attention to the risk associated with negative rewards, also shows negative values for Bitcoin (-0.27) and SSE Composite (-0.32).
These values indicate that over the period, asset returns were below the expected risk-free rate and this loss was not offset by risk.
If the Sortino Ratio is used for comparison with S&P 500 index, the following can be seen. If the Sortino Ratio value for Bitcoin is higher than for the S&P 500, indicating a higher return to risk considering only negative asset price fluctuations. This may indicate that investing in Bitcoin provides more stable returns compared to investing in the S&P 500, especially when accounting for losses.
Users can get BTC, ETH and other cryptocurrencies on SimpleSwap.
Summary
As a result of the last 30 days, the following conclusions can be drawn regarding the correlation of Bitcoin with Nasdaq 100, S&P 500, and U.S. Dollar Indexes.
First, there is a low correlation between price of Bitcoin and the Nasdaq 100 and S&P 500 indexes. This implies that changes in the value of Bitcoin are less dependent on events affecting the U.S. stock markets.
Besides, Bitcoin shows a high correlation with the Chinese market, and this could be the result of various factors including news and investment activity.
The information in this article is not a piece of financial advice or any other advice of any kind. The reader should be aware of the risks involved in trading cryptocurrencies and make their own informed decisions. SimpleSwap is not responsible for any losses incurred due to such risks. For details, please see our Terms of Service.


