Long-Term Investment Strategy: SMA100 & MACD
Key Insights
- A detailed market strategy utilising SMA100 (Simple Moving Average) and MACD (Moving Average Convergence Divergence)
- Theoretical part of the long-term investment trading strategy with charts, trends, time frames, and indicators
- Practical part of the trend-following trading strategy that allows for putting the theoretical knowledge into practice
In financial markets, successful trading depends on careful analysis and informed decision making.
Developing an effective trading strategy is a key element of success for a trader or investor. In this context, it is important to understand not only the theoretical foundations of the market, but also the ability to apply them in practice using relevant analysis tools.
Strategy’s Charts, Time Frames, Trends, and Indicators
A trading strategy consists of several main components, each of which plays an important role in the analysis and decision-making process.
- Choosing a chart time frame
This id one of the first and important steps in developing a trading investment strategy in the financial markets. Different chart time frames provide traders with different information and perspectives on the market.
- Daily chart
Using a daily chart provides a longer term perspective on the market. Each candle on a daily chart represents price activity for one trading day. This time frame can be useful for traders who prefer long-term strategies or who are unable to follow the market in real time.
- Weekly chart
The weekly chart summarizes price activity for each trading week. It provides a shorter-term perspective than a monthly chart, but a longer-term perspective than a daily chart. This time frame can be useful for traders who prefer medium-term strategies or want to see the overall trend of the market over a long period of time.
- Monthly chart
A monthly chart displays price activity for each trading month. It provides the longest term perspective on the market. The monthly chart is useful for investors who are interested in long-term investments or want to assess the overall trend of the market over many years.
The choice of chart time frame should be tailored to the trading objectives and strategy of the trader or investor.
Short-term traders may prefer to use shorter time frames, such as a 15-minute or 1-hour chart, to get a more detailed view of price trends. Whereas investors focused on long-term trends are more likely to use longer time frames.
Trend Filter
The trend filter plays a key role in trading strategy, allowing traders to identify the main direction of market movement and filter out noise in price activity. One of the most common and effective methods of trend filtering is the use of a moving average.
The essence of this method is to calculate the average value of price data for a certain period of time and display it on a chart. Since the moving average averages price dynamics, it helps to smooth out random price fluctuations and highlight the main direction of market movement.
Depending on the time period chosen for the moving average, traders can evaluate different time horizons of the trend:
- Short period moving average
If a short period for the moving average is used (e.g., 20 or 50 periods), it can help traders assess the short-term trend of the market.
- Long period moving average
If a long period moving average is used (e.g. 100 or 200 periods), it can help traders assess the long-term trend of the market.
Based on the position of the price chart relative to the moving average, traders can draw various conclusions about the current trend:
- If the price is above the moving average, it may indicate an uptrend.
- If the price is below the moving average, it may indicate a downtrend.
- If the price is fluctuating around the moving average with no clear direction, it may indicate a sideways or horizontal trend.
The moving average trend filter is one of the basic analysis tools that helps traders make more informed trading decisions given the current direction of the market.
What is MACD
Trend reversal momentum indicators play an important role in market analysis, helping traders identify changes in the strength or direction of a trend. One of the most widely used indicators of this type is MACD (Moving Average Convergence Divergence).
MACD indicator is based on the difference between two moving averages, usually exponential. It usually consists of two lines:
- MACD line
It is the difference between the fast (short term) and slow (long term) exponential moving averages. It shows the dynamics of price changes and can help to identify the direction and strength of the trend.
- Signal Line
This is a moving average (usually exponential) on the MACD line. It smooths the MACD line and is used as a signal to enter or exit positions.
How to determine the momentum of a trend reversal with MACD
- Zero Line Crossing
When the MACD line crosses the zero line from top to bottom, it can signal the beginning of downward momentum, and when it crosses from bottom to top, it can signal the beginning of upward momentum.
- Signal Line Crossing
When the MACD line crosses the signal line from top to bottom, it can be a sell signal, and when it crosses from bottom to top, it can be a buy signal.
- Divergence
When prices make new highs and the MACD line does not confirm these new highs, it can indicate a potential weakening of the trend and a possible change in direction.
- Convergence
When the MACD line and prices move in the same direction, it may confirm the strength of the current trend.
Using the MACD in conjunction with other trend indicators and filters can help traders make more informed decisions about entering and exiting positions in the market.
Time Frames and Trends in Practice
Let's put the acquired knowledge into practice by developing a trading strategy based on the mentioned components:
- Time frame selection
We will choose a daily chart to analyze in order to get a longer term perspective.
- Trend Filter
On the chart, we used the 100-day moving average SMA 100 as a trend filter. When the price is above this line, it signals an uptrend.
- Trend reversal momentum indicator
We used the MACD oscillator to determine the momentum. When the MACD is above the zero line, it indicates bullish momentum, which can be a signal to open a long position. You can get crypto assets to invest in on SimpleSwap.
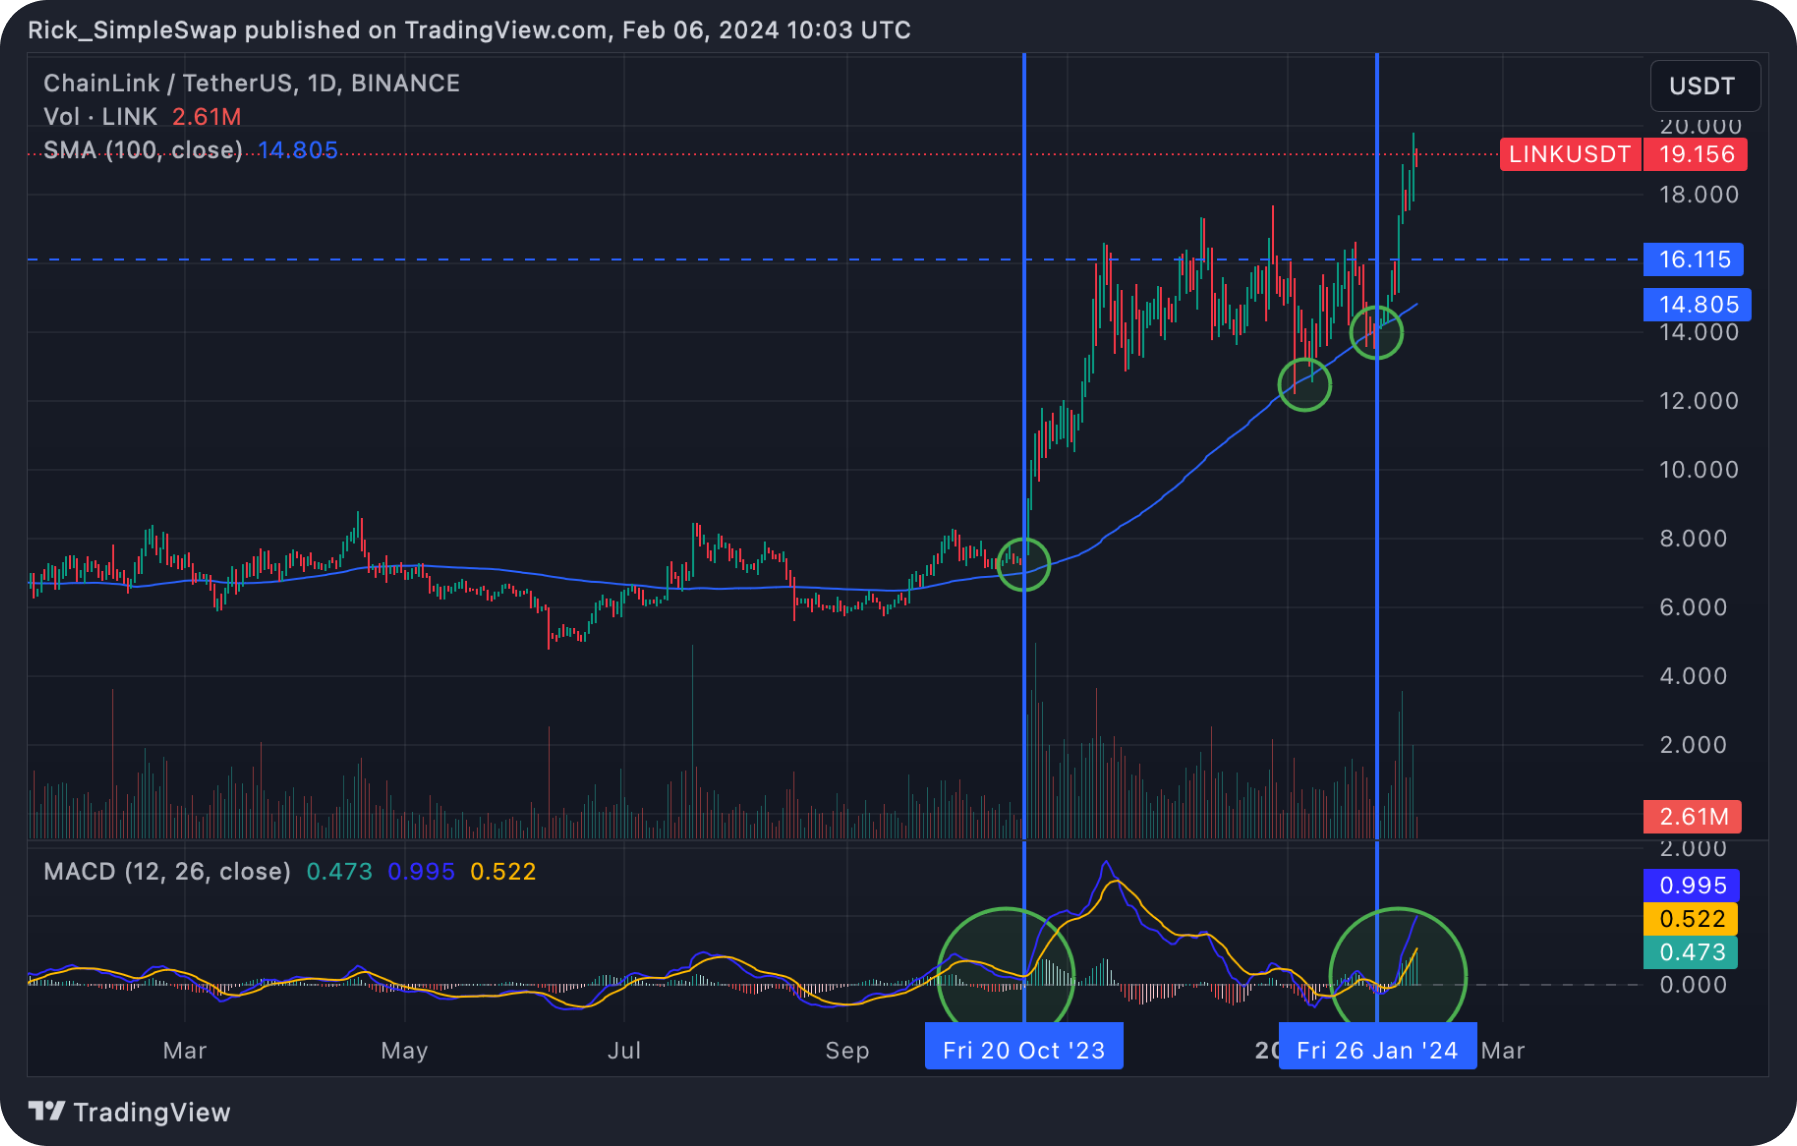
In this example, the chart, while in a sideways trend, continues to trade near the SMA100 level.
Then, after crossing the SMA100 level upwards, the chart tests it as support and bounces off it, starting an uptrend. In parallel, the MACD indicator also crosses the zero line upwards and then tests it as confirmation of the start of the uptrend.
Summary
This market strategy that uses SMA100 and MACD allows making informed investment decisions. In this article we provided a deep look into theoretical part of the strategy, encompassing various trends, charts and indicators.
In the practical part of the article we show how the theoretical knowledge can be put into practice. Only a deep understanding of the market combined with the ability to apply various analysis tools allows a trader or investor to make informed decisions and achieve desired results in the financial markets.
Users can get crypto assets to test this strategy on SimpleSwap.
The information in this article is not a piece of financial advice or any other advice of any kind. The reader should be aware of the risks involved in trading cryptocurrencies and make their own informed decisions. SimpleSwap is not responsible for any losses incurred due to such risks. For details, please see our Terms of Service.


