Ichimoku Cloud
Key Insights
- The 200 EMA defines the overall trend, while the Ichimoku Cloud indicates bullish/bearish trends and potential support/resistance levels.
- Entry signals occur on a bounce off the 200 EMA, MACD crossover below 0, and green Ichimoku Cloud color.
- Exits are triggered by an MACD crossover above 0 and red Ichimoku Cloud, securing gains from the momentum trade.
In this crypto strategy, you’ll be guided through trading with a compilation of 3 indicators: 200 EMA, Ichimoku Cloud, and MACD. The indicators described in this strategy can be used in a huge number of strategies and combinations.
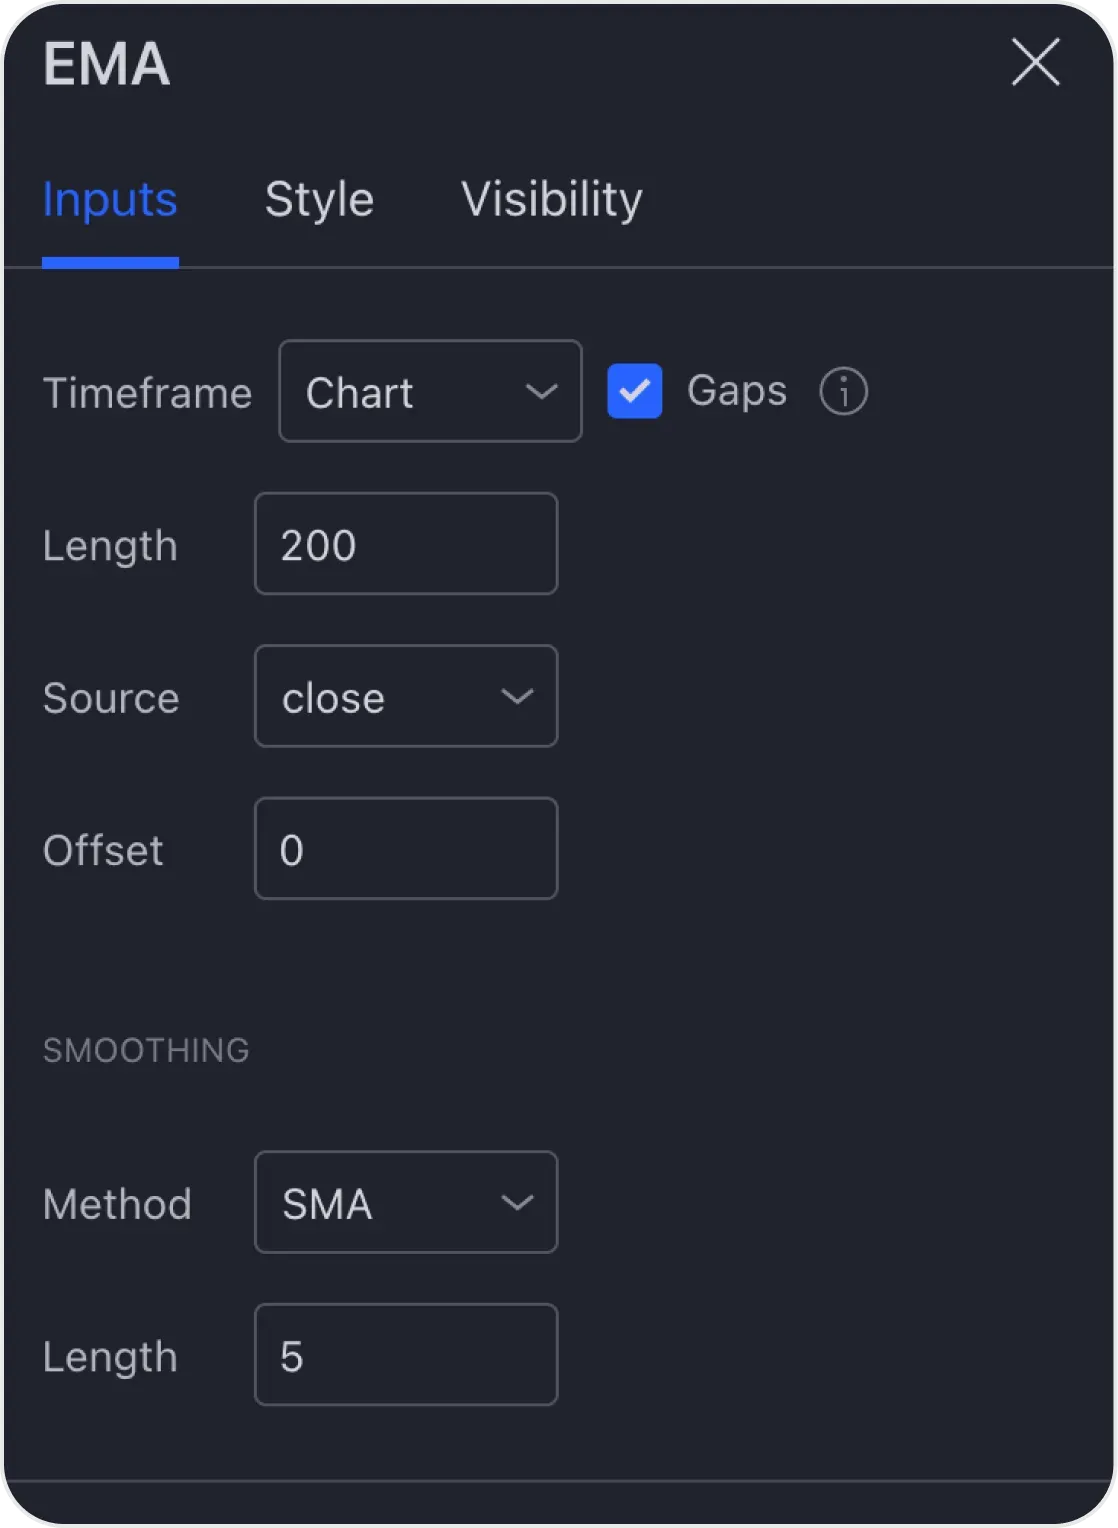
What Is 200 EMA
200 EMA (Exponential Moving Average) is a technical analysis tool. It’s a line showing the average price for the last 200 candles on the selected timeframe.
The Exponential Moving Average is renowned for its swift response to recent price movements, contrasting with the Simple Moving Average (SMA), which exhibits a more pronounced delay.
Primarily, EMA is employed to smoothen price fluctuations and filter out short-term noise from the market dynamics. Similar to other moving averages, EMA serves as a pivotal tool for generating buy and sell signals by detecting crossovers and divergences from the historical price average.
This weighting scheme ensures that recent price changes carry more influence on the EMA compared to the SMA, where all observations in the period are accorded equal weight.
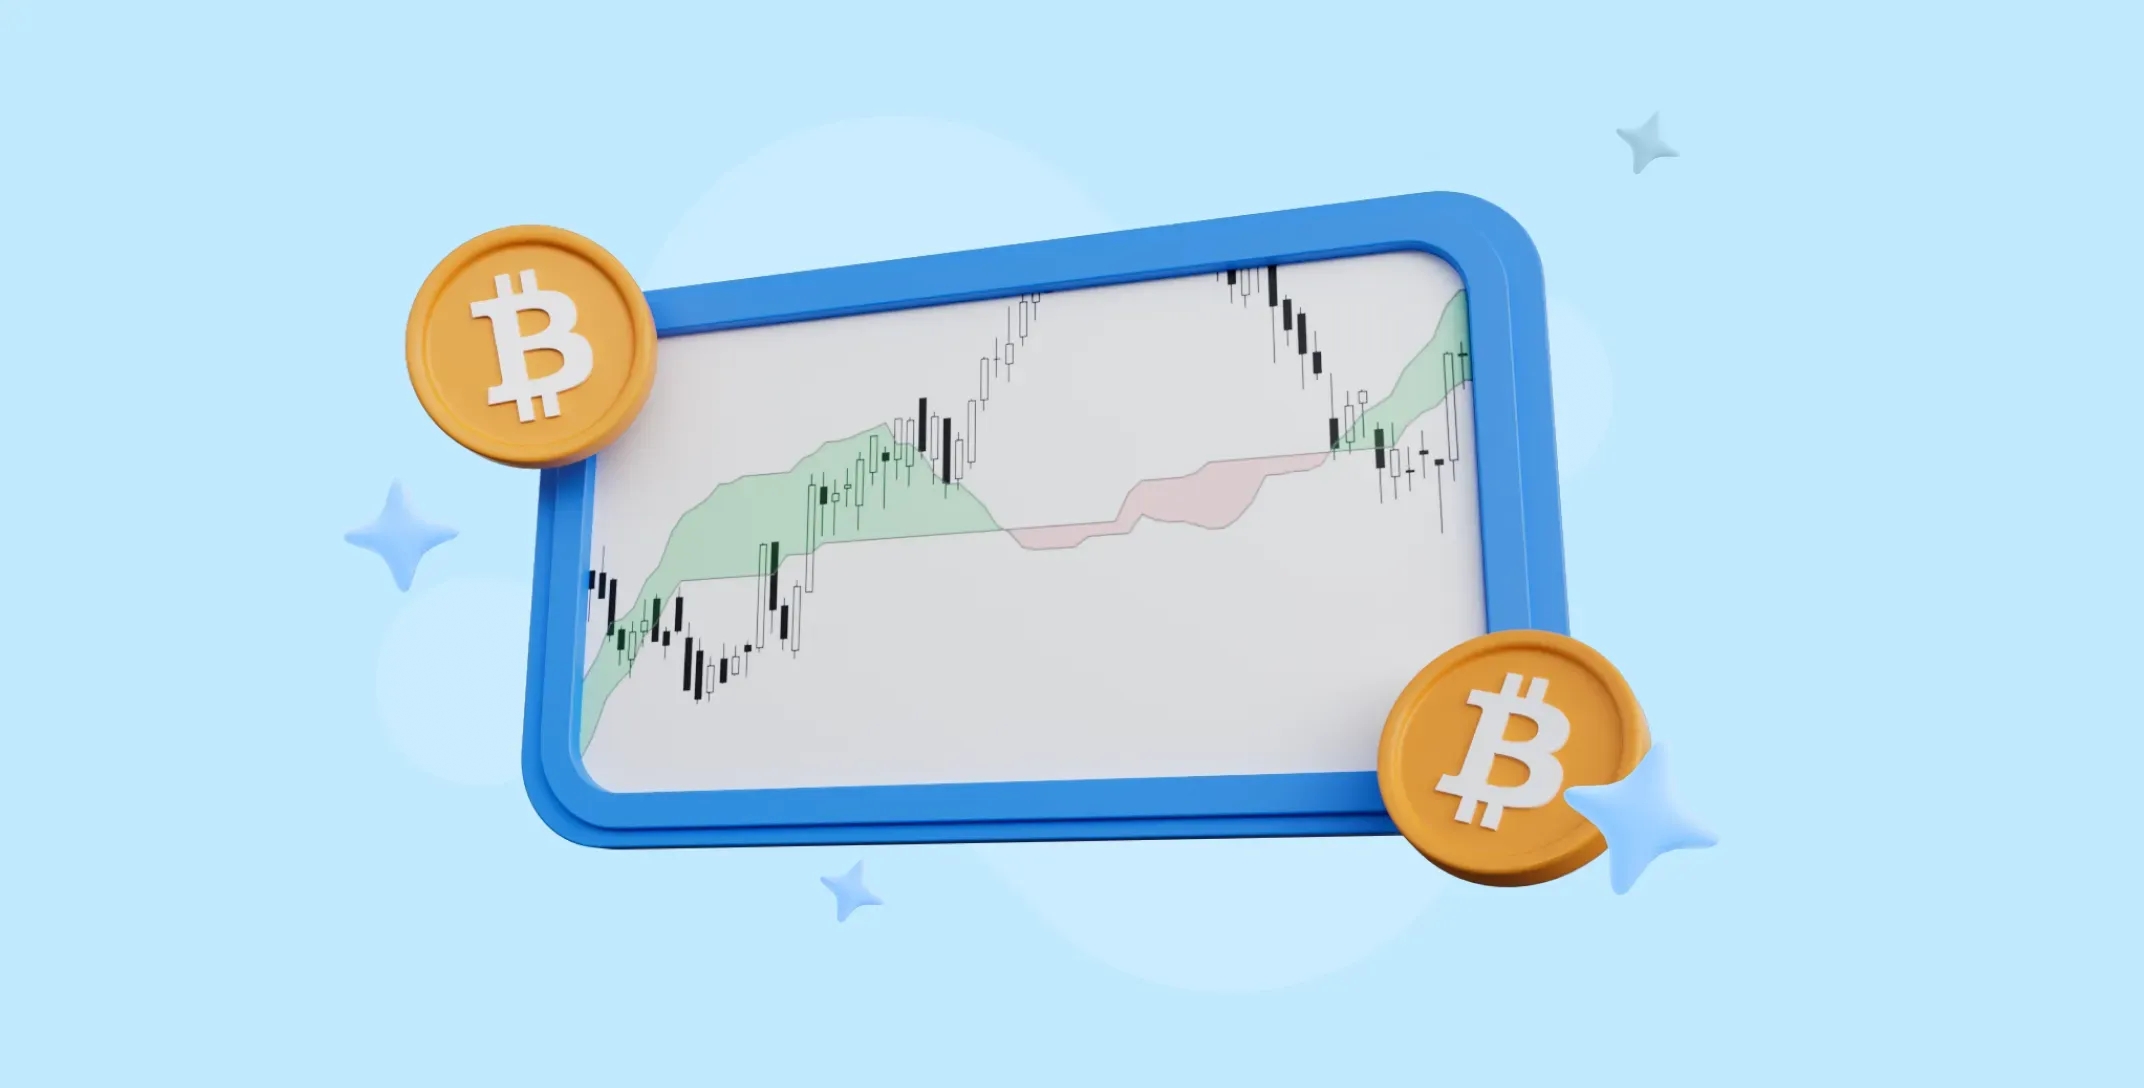
What Is Ichimoku Cloud
Ichimoku Cloud is a technical indicator that tells traders about the market (whether it’s bearish or bullish), support and resistance levels, and probable trend changes.
The Ichimoku Cloud is an indicator that looks like a cloud on a price chart. It shows what the general market trend is at any given moment.
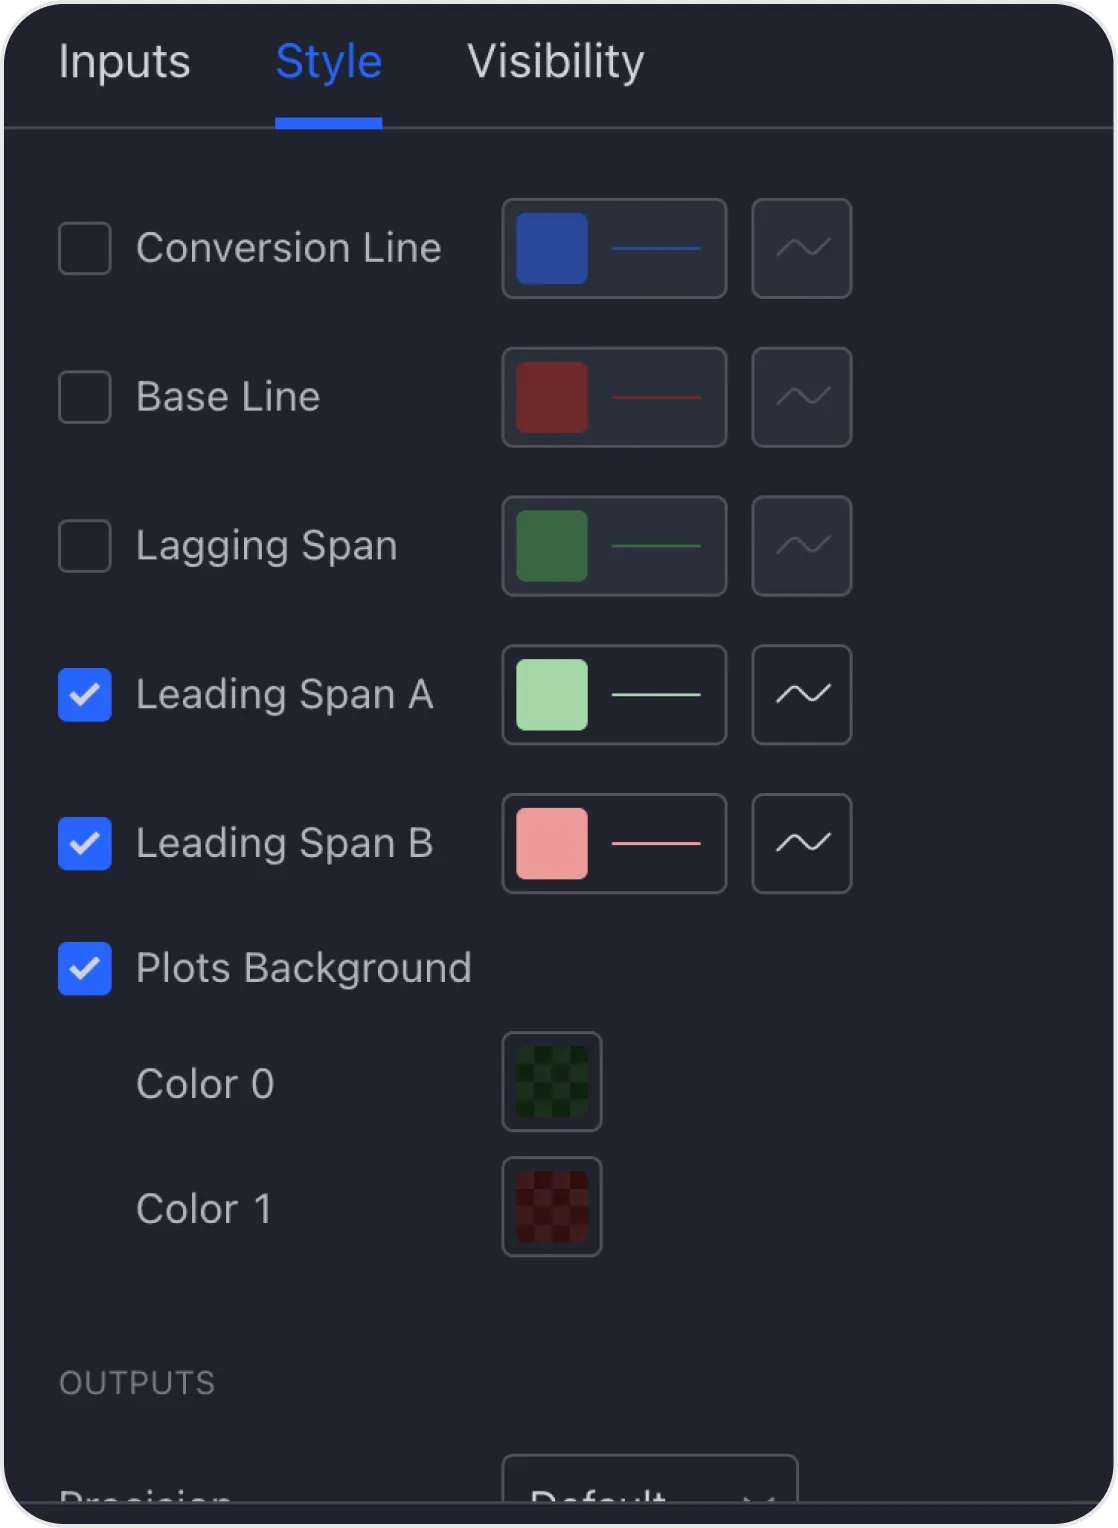
The Ichimoku cloud itself appears red when the market price is in a downtrend and green when it's in an uptrend.
In the case of this strategy, we use Ichimoku Cloud to measure market sentiment.
What Is MACD
Trend reversal momentum indicators play a pivotal role in market analysis, assisting traders in identifying shifts in the strength or direction of a trend.
One of the most widely utilized indicators of this type is the MACD (Moving Average Convergence Divergence) indicator.
MACD is an indicator that visualises the convergence and divergence of the lower moving averages.
The MACD indicator is based on the difference between two moving averages, typically exponential.
Indicator Settings
- 200 EMA
EMA assigns greater importance to the latest data points, hence its alias, the Exponentially Weighted Moving Average.
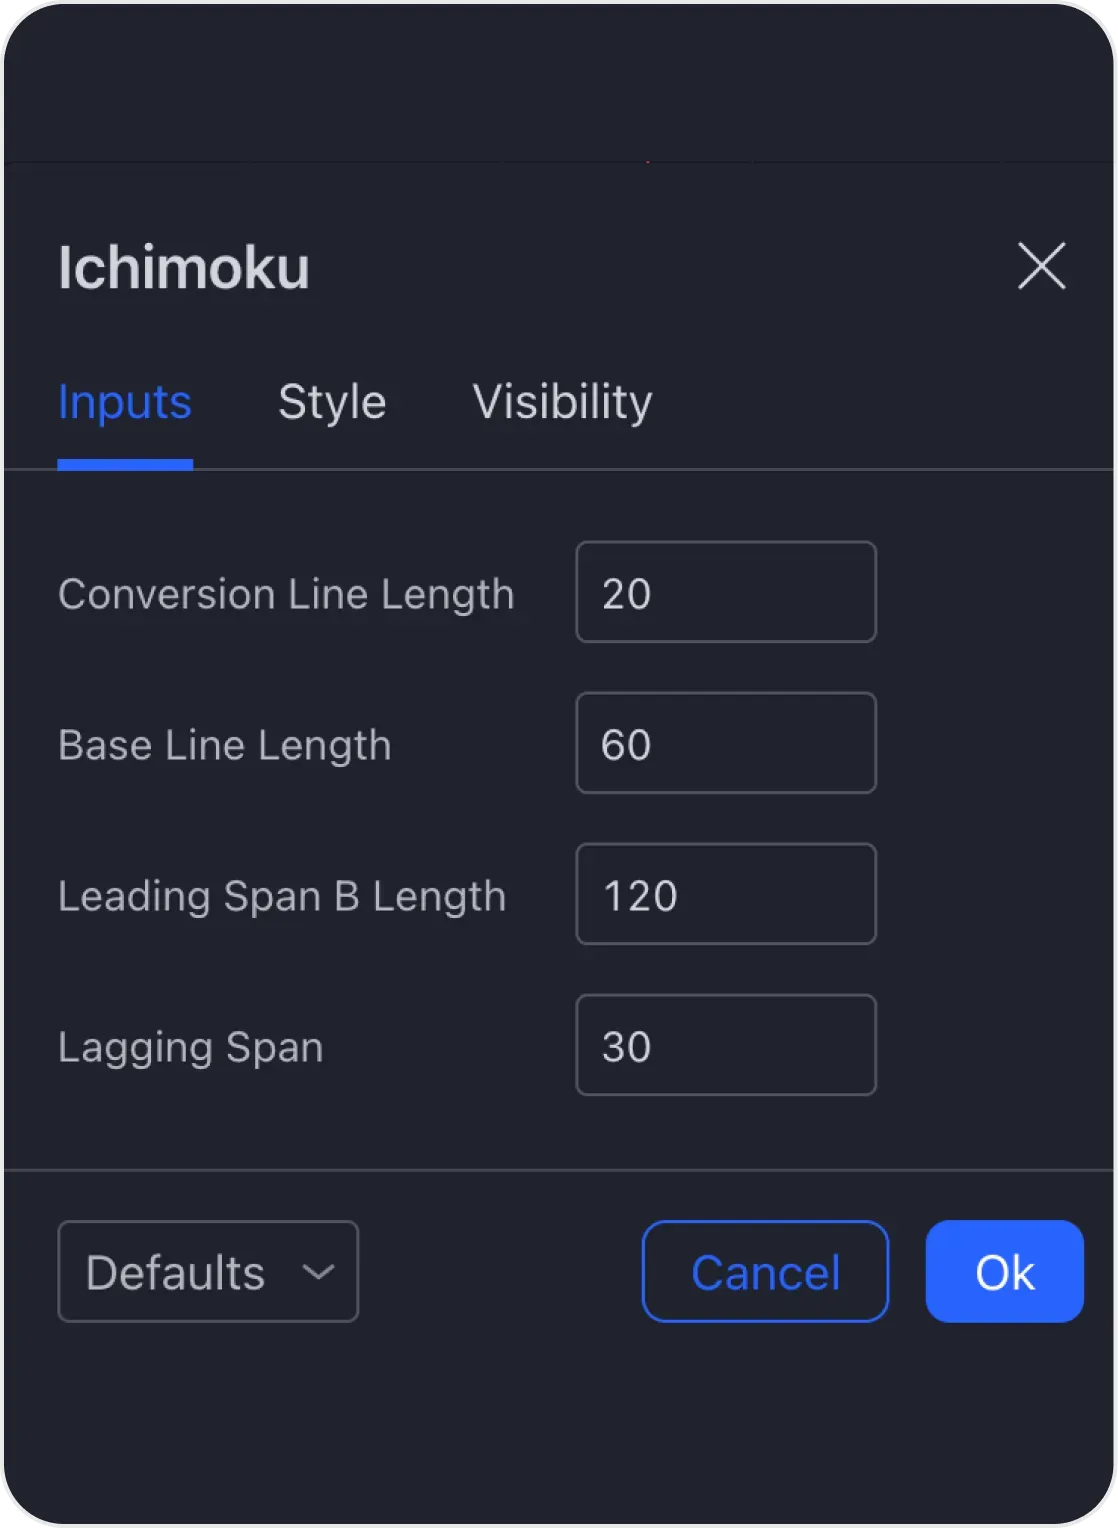
- Ichimoku Cloud
These settings indicate the periods of line calculation. They are displayed on the price history of the instrument for the clouds' formation.
In simple words, it takes different time periods where the maximum and minimum prices are added up and divided by 2. Ichimoku clouds tell us about the local mood of the market to help us make a trading decision.
We would only use Leading Span B Length and Lagging Span inputs for our strategy out of 4 major ones.
- Conversion Line Length
Conversion Line Length is a 20-hour moving average used to smoothing price fluctuations. It doesn't show up in our strategy, and it’s used to form clouds.
- Base Line Length
Base Line Length is a 60-hour moving average used to smoothing price fluctuations. It too doesn't show up in our strategy, and it’s also used to form clouds.
- Leading Span B Length
Leading Span B Length is the cloud-forming green line. It shows the likely formation of price support in the future from the settlement period of 120 candlesticks.
- Lagging Span
Lagging Span is the number of candles leading the price to determine the likelihood of support or resistance levels in the future after 30 candles.
Indicators' Application
The signal for opening or closing a deal in this strategy is a set of signals from the indicators we have chosen.
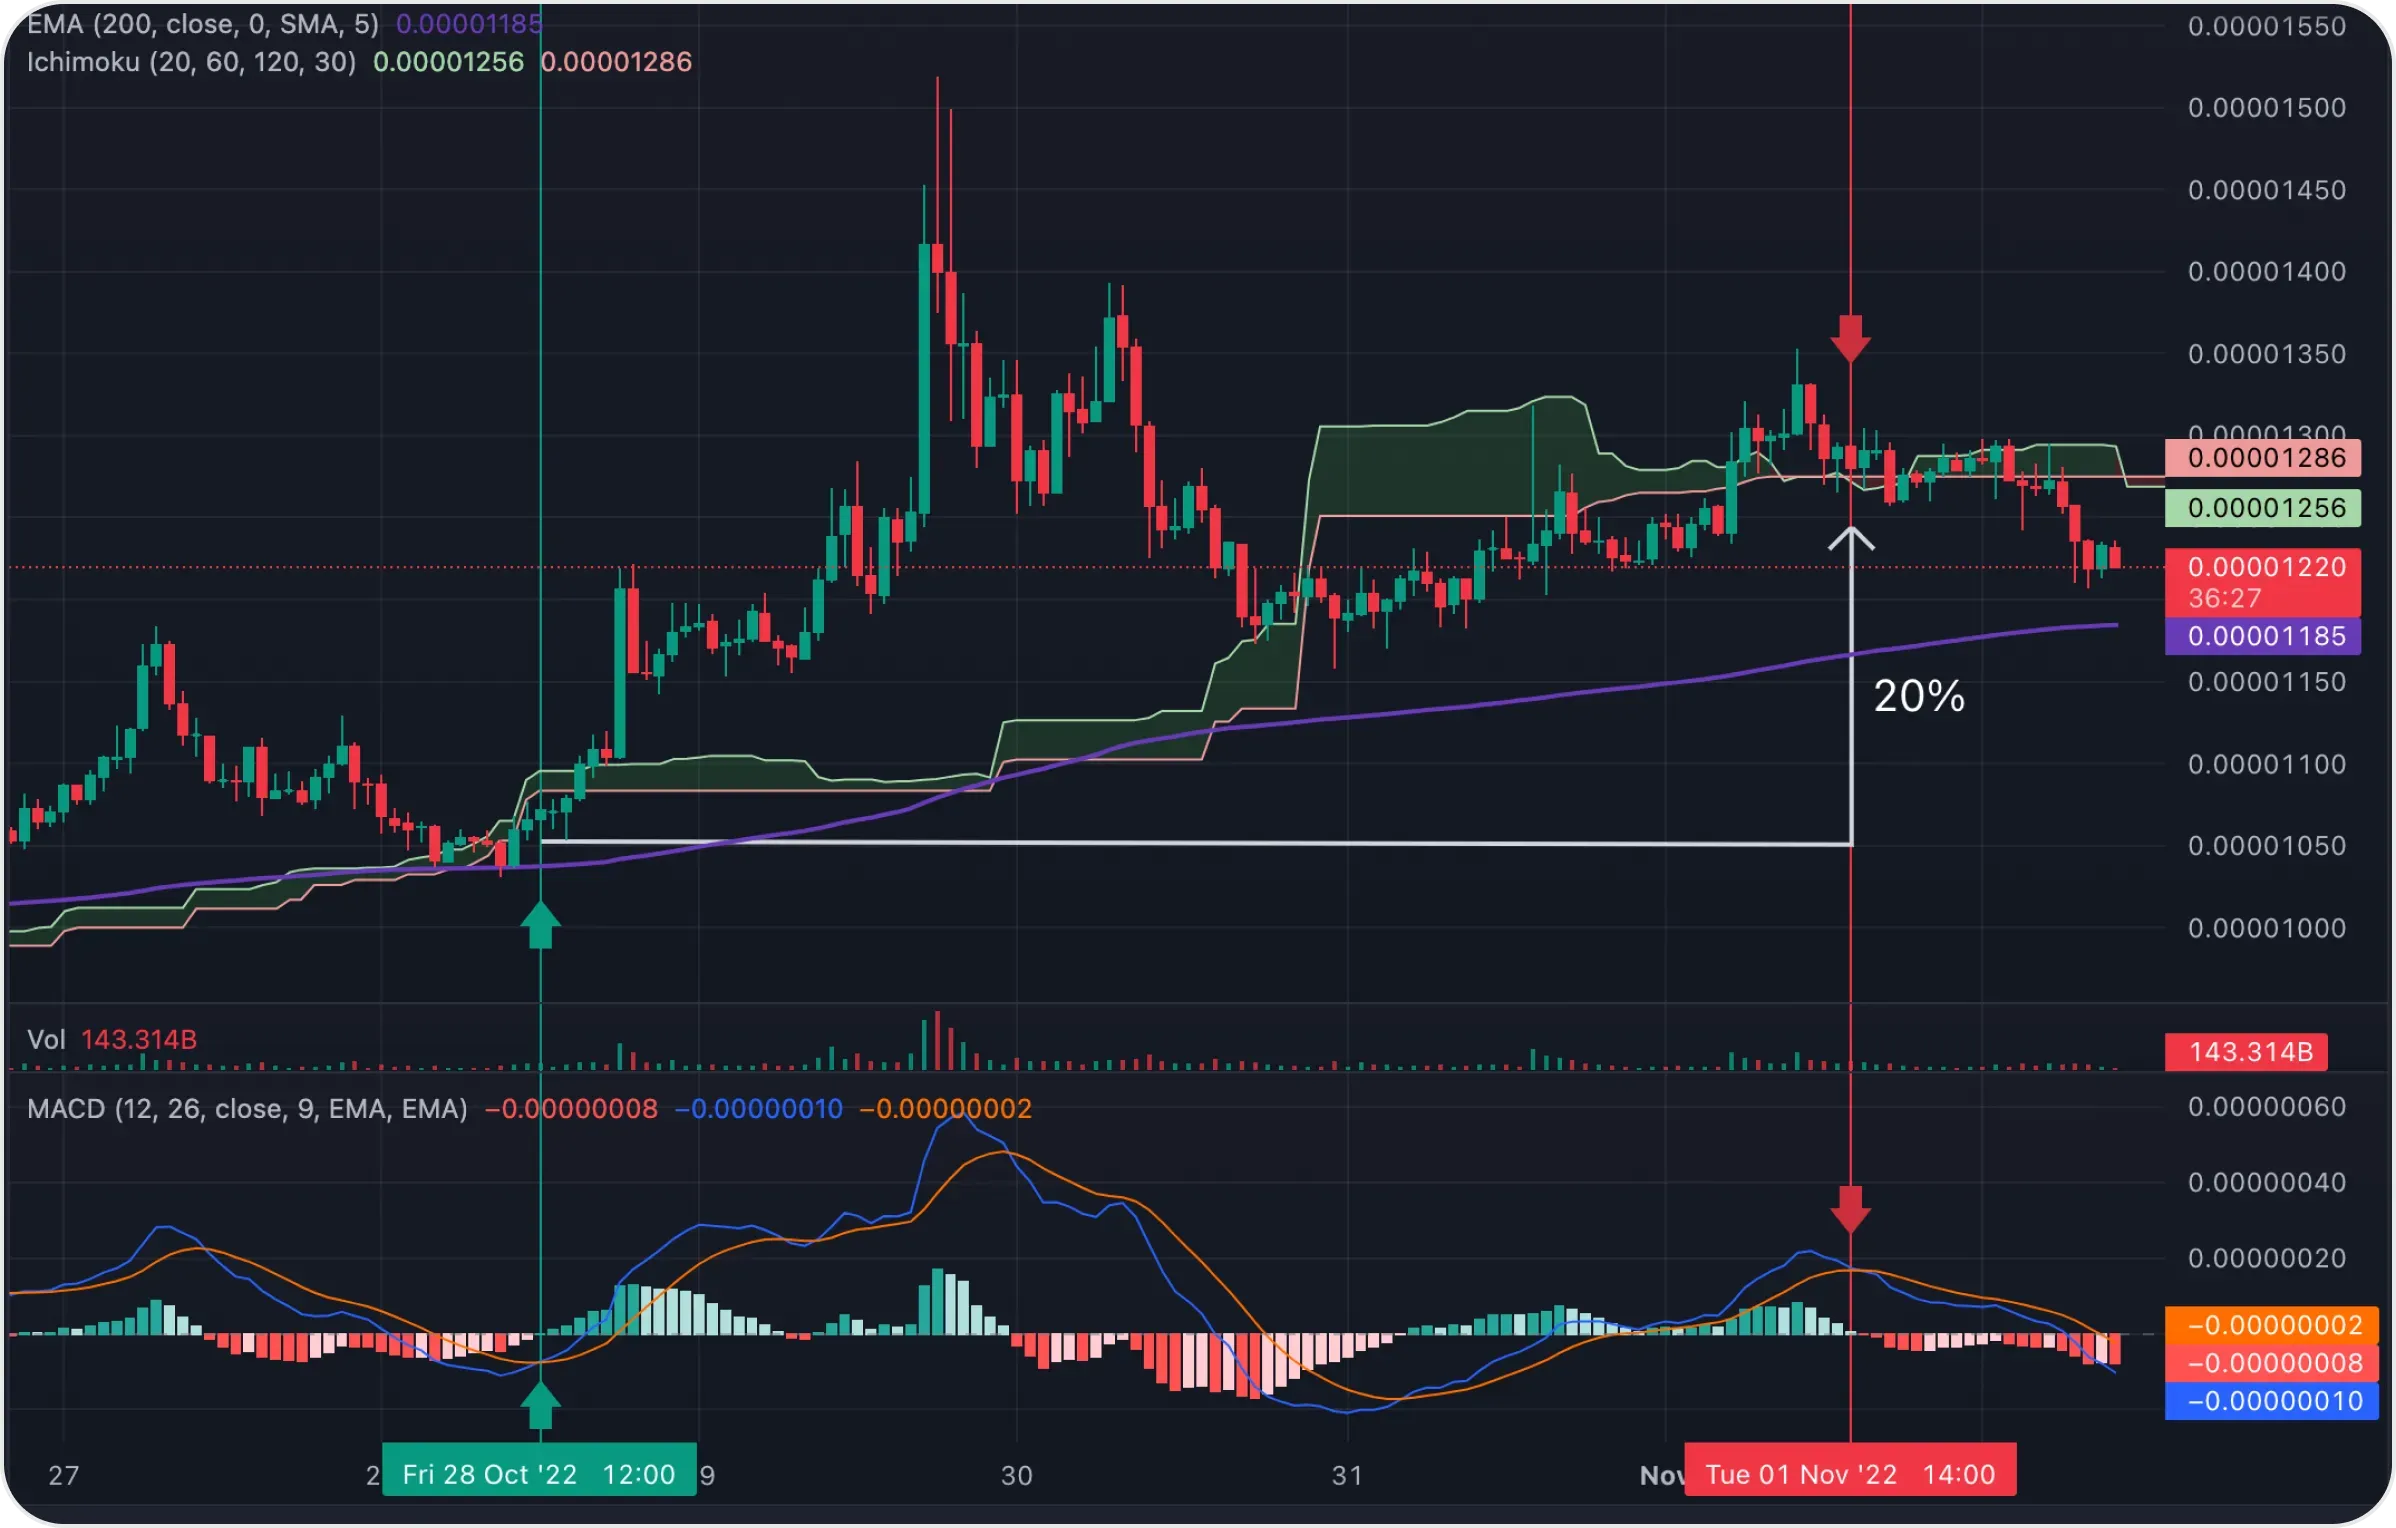
Opening a Deal
- A rebound from the 200-hour moving average up
- A moving averages crossover in the MACD indicator below the zero level
- The green colour of the Ichimoku cloud indicatior
Closing a Deal
- A moving averages crossover in the MACD indicator above the zero level
- The red colour of the Ichimoku cloud indicator
Users can get the desired crypto assets on SimpleSwap.
Summary
This strategy provides a comprehensive framework for trading utilizing three key indicators: the 200 EMA, Ichimoku Cloud, and MACD.
By leveraging these indicators, traders can effectively identify trends, support/resistance levels, and potential entry/exit points.
The 200 EMA acts as a trend-defining metric, while the Ichimoku Cloud provides insights into market sentiment and trend direction. Meanwhile, the MACD serves as a momentum indicator, aiding in the identification of trend reversals.
By combining these indicators and adhering to the specified entry and exit signals, traders can make informed trading decisions and maximize their trading opportunities.
The information in this article is not a piece of financial advice or any other advice of any kind. The reader should be aware of the risks involved in trading cryptocurrencies and make their own informed decisions. SimpleSwap is not responsible for any losses incurred due to such risks. For details, please see our Terms of Service.


