If I Hodl, When Do I Stop?

This blog post will cover:
- The HODL strategy
- When it is time to fix the profit?
- RSI indicator
- On-chain indicator “MVRV Z-Score”
The HODL strategy
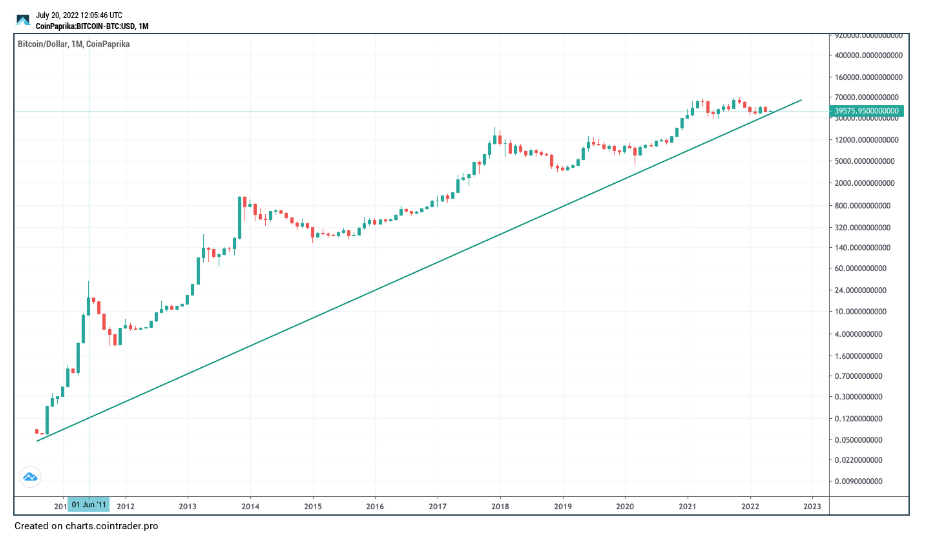
Long-term cryptocurrency owning, also known as a Hodl strategy, is good for beginners or passive investors. As the crypto market kept growing, the prices for leading digital assets were continuously increasing. In a long-term perspective, top assets grow by means of the market development and the investors-newcomers. Let’s pay attention to the logarithmic Bitcoin graph since August 2010 that confirms this:
An important factor for a successful investment under the Hodl strategy is a careful selection of crypto projects. It is necessary to carefully investigate the idea and goals of the project, to estimate the possible prospects of their implementation. The project team plays a very important role in the further development of the project, as it is they who will implement the intended. Following this strategy, it’s better to pay more attention to projects from the TOP 20, as the ownership of coins of young and little-known projects can lead to a complete loss of invested capital. However, even owning the top coins won’t insure you against losses, as the collapse of Terra in 2022 showed us.
Having fulfilled all the conditions to select the coins for the investment portfolio of a long-term hodler, it is necessary to move to the careful monitoring of the market trends situation. If you don’t pay enough attention to the market, you can miss a good moment to fix the position for which the coins were held for several years.
When it is time to fix the profit?
The situation when the upward trend is unfolding suggests that it is time to fix the profit.
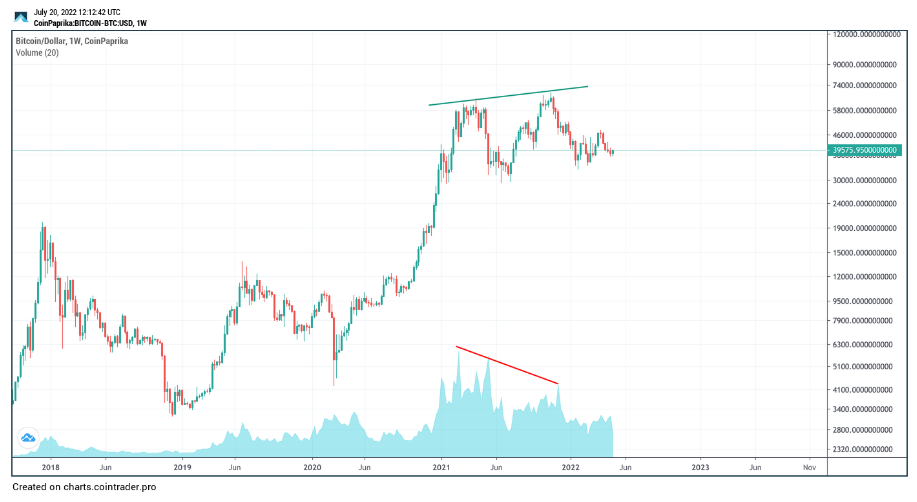
Let’s take a look at the example of the BTC trend reversal of 2021, we predicted a bear divergence on the indicator of VOL trading volumes on a weekly time frame of the logarithmic graph. The price continues to rise but at the same time trading volumes have started to fall. The situation is incompatible with the growing market. It tells us that the big players have stopped buying BTC and begun to fix their positions by splitting their volume into several parts. In this way, they try not to expose their intentions but sell at the best bargain price.
RSI indicator
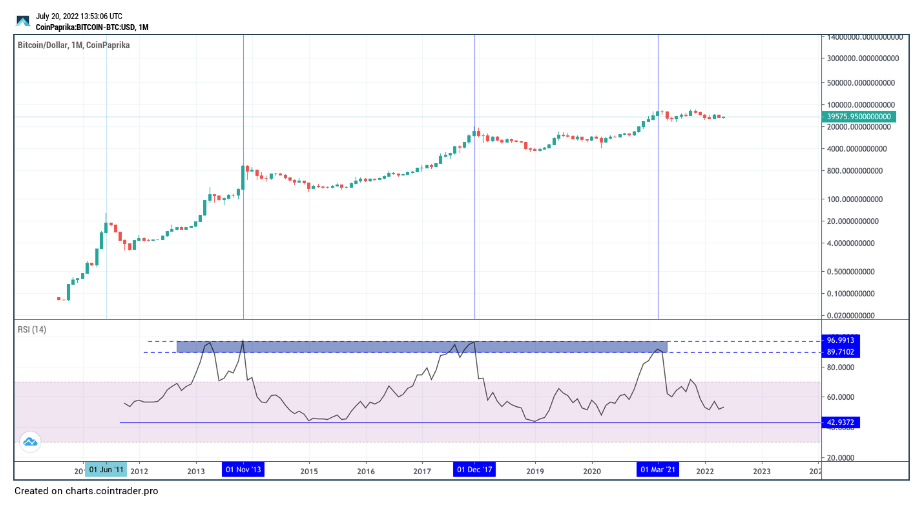
An oscillator of the relative strength is well-showing the peak zone and the price bottom zone of the last three BTC cycles. The zone is in the range of 90 and 97 on the Relative Strength Index (RSI) indicator scale on the monthly timeframe of the logarithmic graph.
On-chain indicator “MVRV Z-Score”
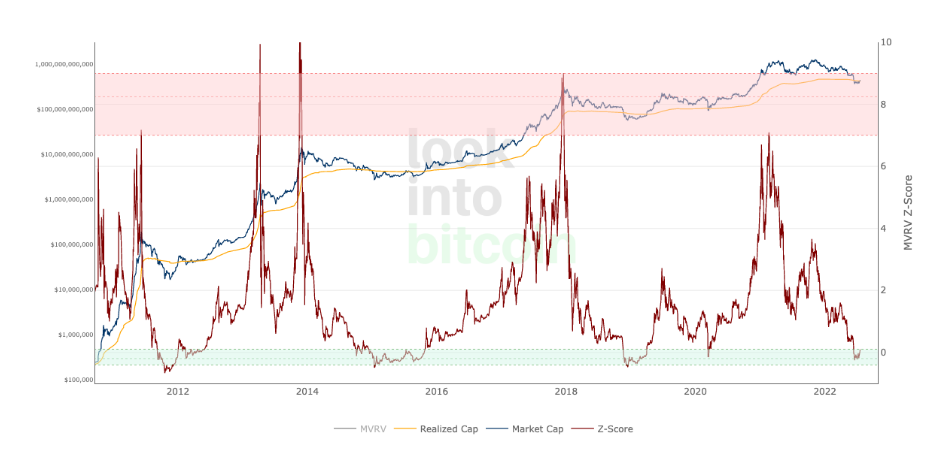
This indicator shows a Bitcoins diagram and analyses the coins’ movement in the blockchain for defining the comfortable prices to buy and sell BTC.
The green range serves as a good zone for BTC purchases before the new uptrend.
The red range serves as an overbought BTC zone and warns about the soon start of the downtrend.
As you can see, there are some indicators that might help you to think through your HODL strategy. However, there is no universal advice. Always try to get as much information as possible, keep track of the situation in the cryptocurrency market, and make your own research to feel confident about your crypto portfolio.
SimpleSwap reminds you that this article is provided for informational purposes only and does not provide investment advice. All purchases and cryptocurrency investments are your own responsibility.