BTC On-Chain Analysis April-May

Key Insights
- As large players increase their positions in BTC, this can create a powerful signal for other market participants, including smaller investors.
- An increase in the number of transactions by large players can increase the overall trading volume in the crypto market
- The use of the Stock-to-Flow model by large participants may be another factor that supports their confidence in BTC growth prospects
Below you can read our BTC on-chain analysis for April-May 2024. Look out for updates as we post new analysis every one-two months.
What Is On-Chain Analytics
On-chain analysis, entails the examination of blockchain data encompassing transactions, trades, and wallet address holdings. This analysis provides real-time insights into the activities of market participants within respective blockchains.
For investors and traders looking into this on-chain data unveils crucial information about who holds or trades specific cryptocurrencies, how sophisticated investors are managing their portfolios, and the reactions of token holders to market events.
The term on-chain data pertains to transactions that have been validated and permanently recorded on a blockchain ledger.
Utilizing on-chain analysis involves extrapolating trends and assessing crypto market sentiment by monitoring the movement of funds within the blockchain ecosystem to identify potential investment opportunities.
On-chain analysis relies on various metrics, including active addresses, transaction volume, supply distribution, and total value locked, in conjunction with the price action of an asset.
On-chain data is the one that has been validated and recorded on a blockchain ledger. This validation and recording process is carried out by miners in Proof-of-Work (PoW) blockchains and stakers in Proof-of-Stake (PoS) blockchains. Access to on-chain data is open to anyone, anywhere, as it ispublicly recorded on blockchain ledgers.
This BTC analysis below is based on the following indicators: number of transactions, transactions by size, daily active addresses, balance by holdings, and Stock-to-Flow model.
Number of BTC Transactions
A decline in the value of BTC can encourage crypto market participants to buy, which leads to an increase in the number of Bitcoin transactions. Investors and traders see a drop in price as an opportunity for profitable purchases ("buy the dip"), which increases trading activity.
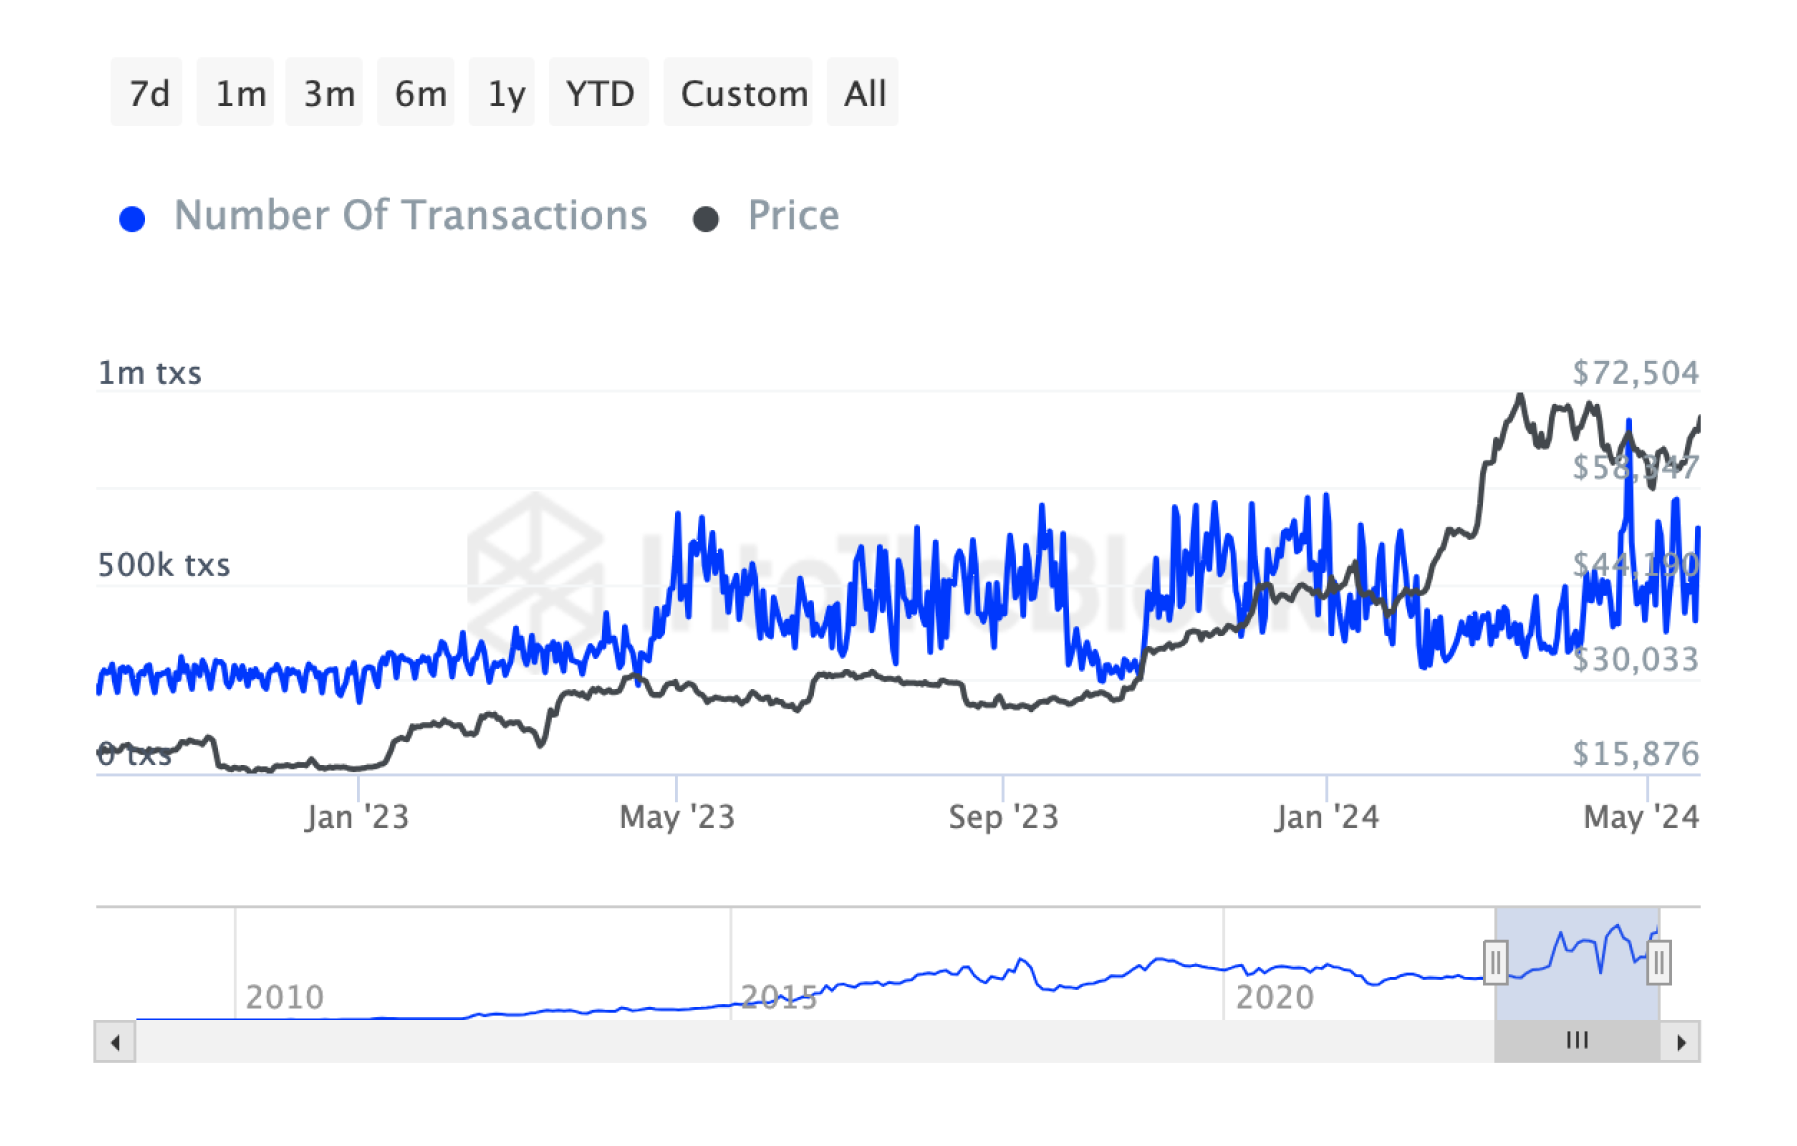
Volatility attracts both short-term speculators and long-term investors, increasing the number of BTC transactions. Portfolio rebalancing and increased activity on exchanges also increase transactions. Falling prices can trigger liquidation margins, which further increases transaction activity on the Bitcoin network.
Bitcoin Transaction Count by Size
The Transaction Count by Size metric of the BTC network shows changes in the number of transactions in different value ranges.
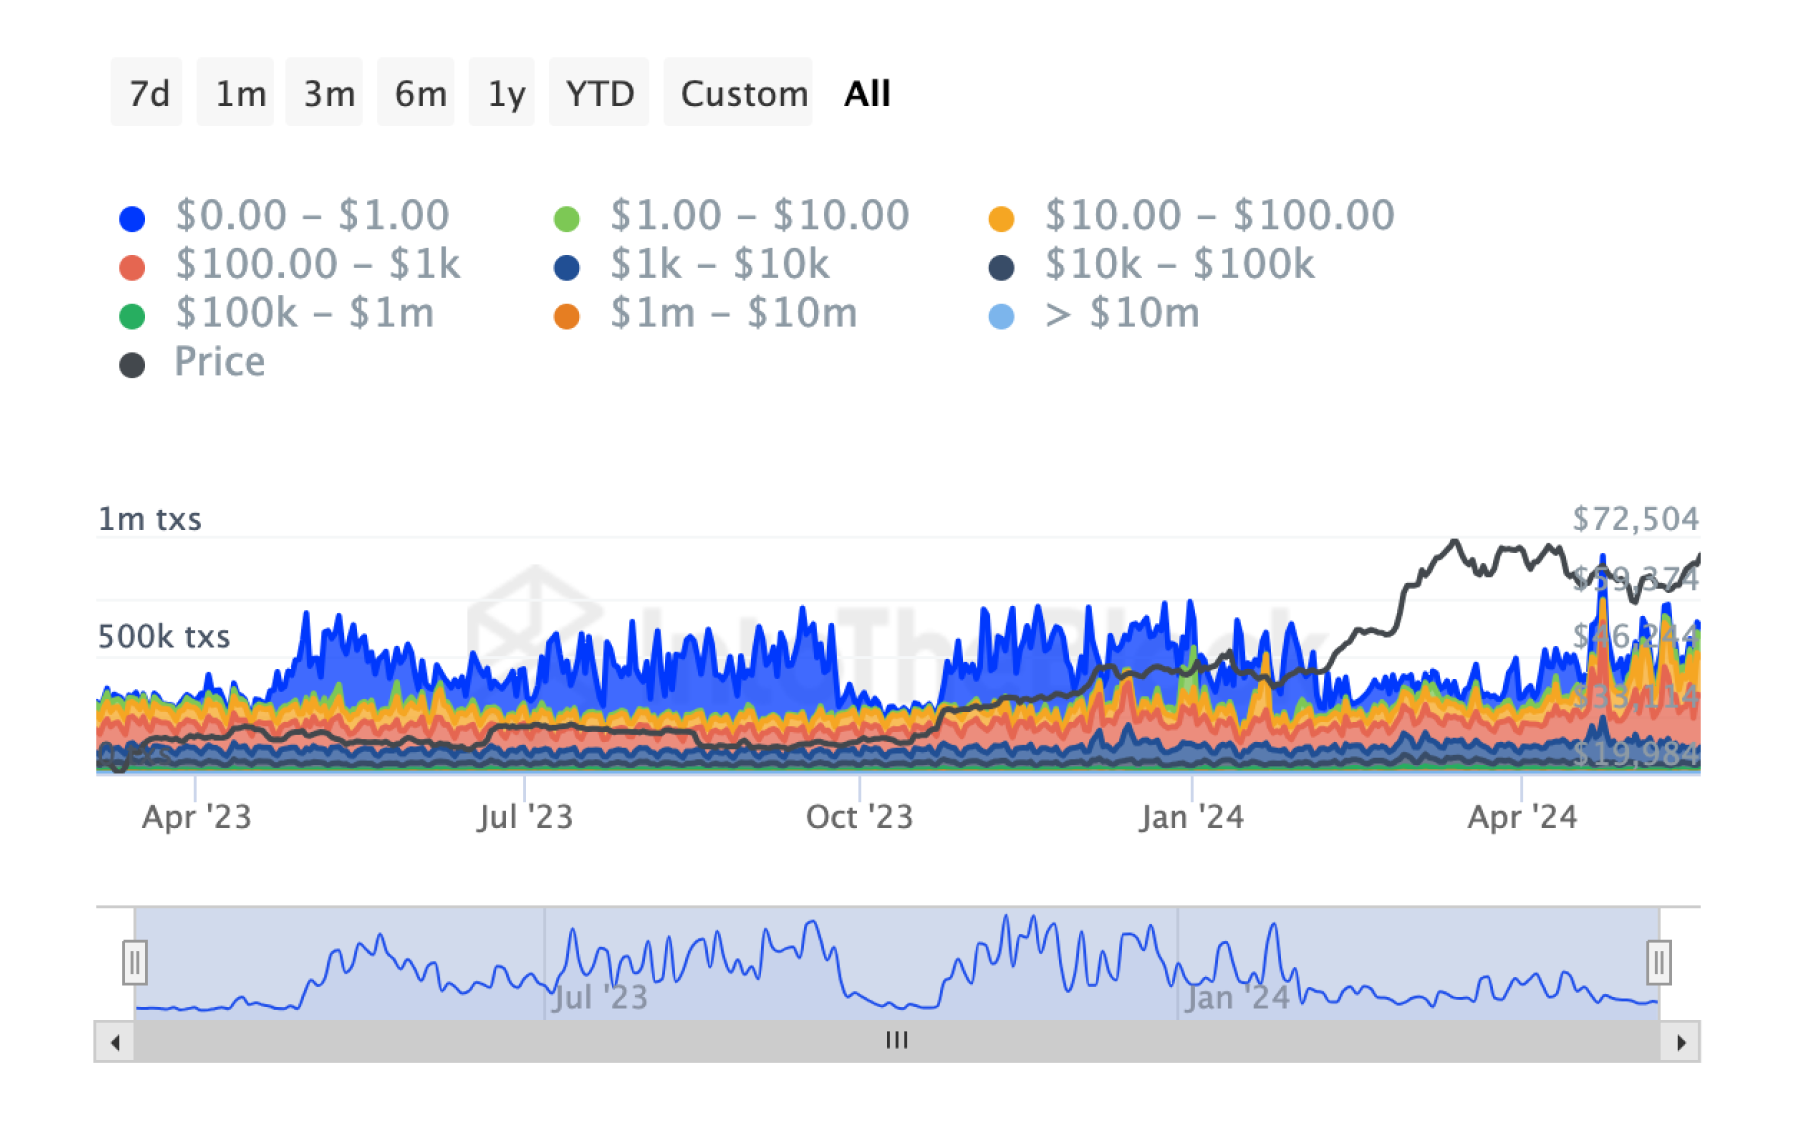
Over the last 30 days:
$0.00 - $1.00: down 73.80%
$1.00 - $10.00: up 801.54%
$10.00 - $100.00: up 72.75%
$100.00 - $1k: down 4.10%
$1k - $10k: down 43.68%
$10k - $100k: up 6.36%
$100k - $1m: up 76.35%
$1m - $10m: up 26.57%
Over $10m: up 375.51%
These data show significant changes in the distribution of BTC transactions by value. Key observations:
Small and medium sized BTC transactions ($1.00 - $100.00) increased significantly, which may indicate an increase in retail purchases or small transfers.
Medium sized BTC transactions ($100.00 - $1k) and large transactions ($1k - $10k) decreased, which may reflect a change in user behavior, possibly moving to other ways of conducting these transactions.
Very large BTC transactions ($100k and above) increased significantly, especially in the ranges over $10m, which may indicate an increase in activity by institutional investors or large players in the crypto market.
Daily Active Bitcoin Addresses
High BTC price can discourage small investors, as buying even a small share of BTC seems expensive.
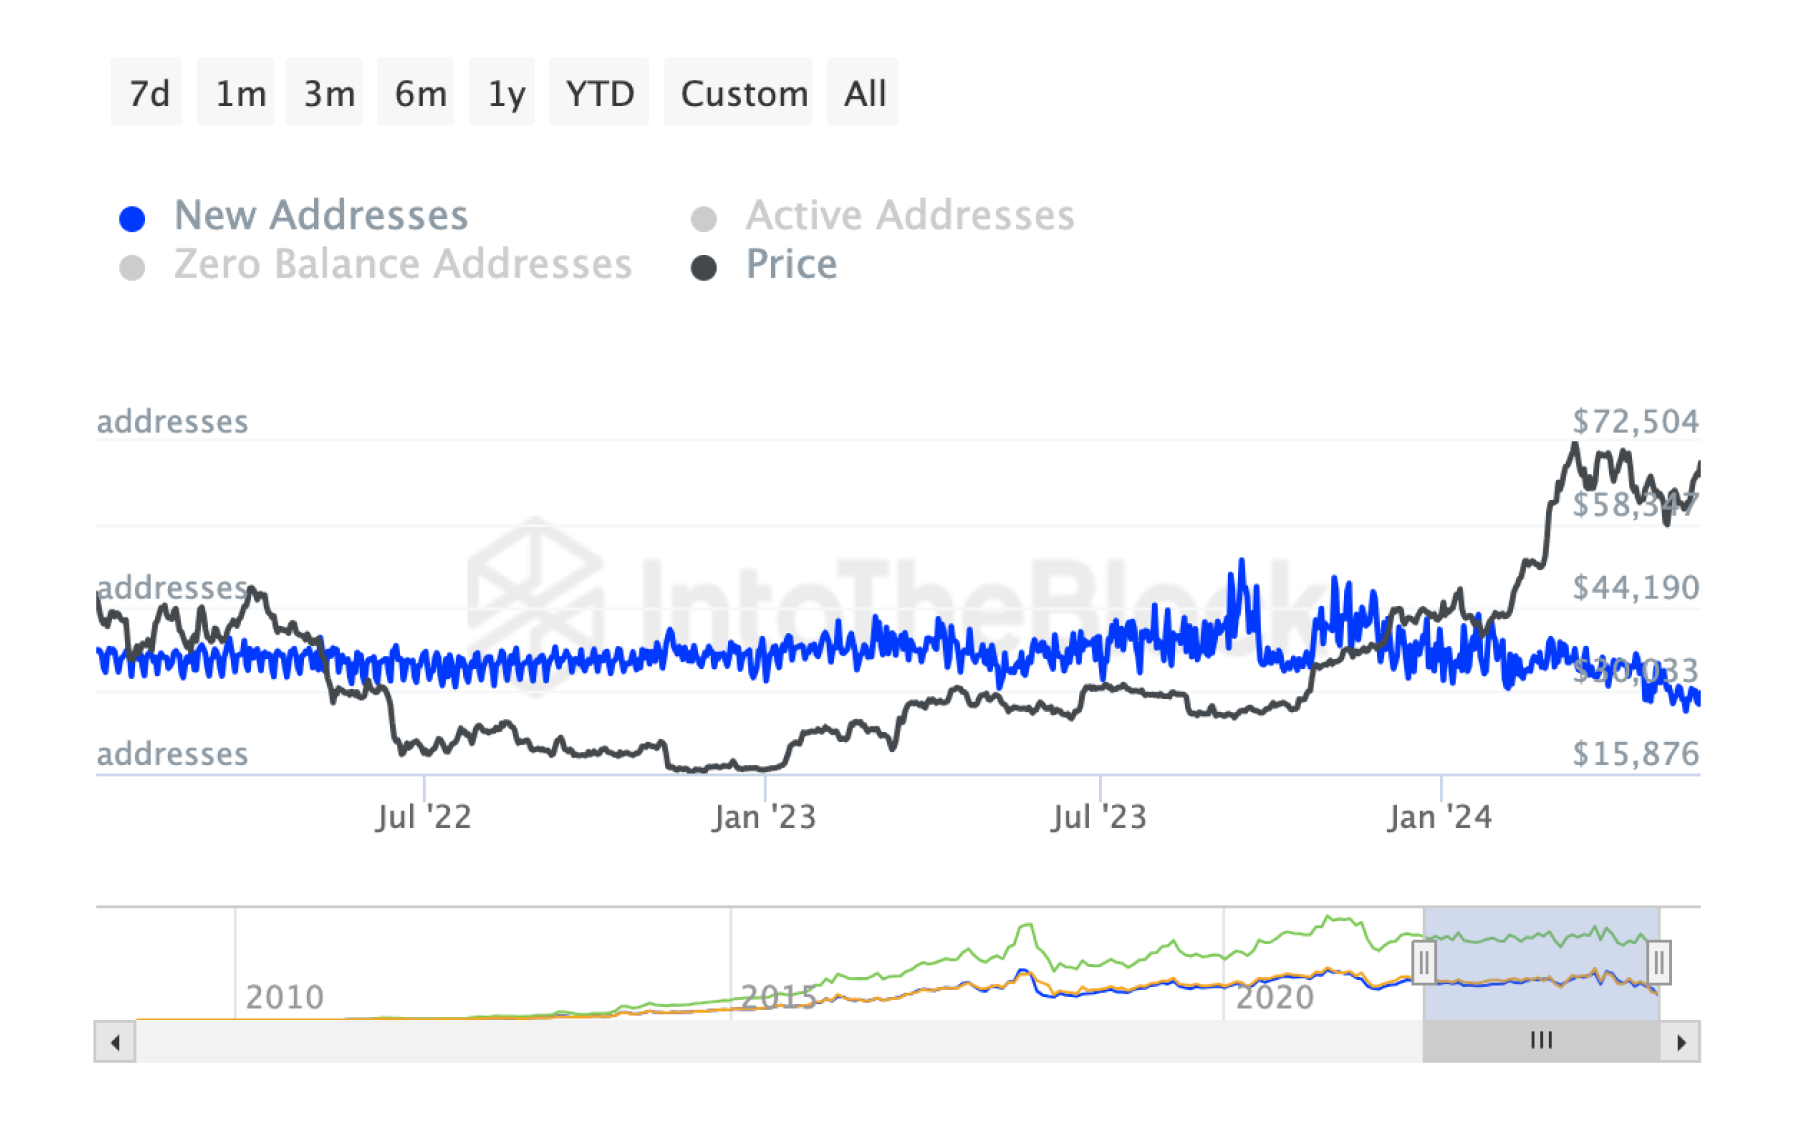
This creates a psychological barrier, as new investors may feel that they have missed the moment to make a profitable BTC purchase. Perhaps most of the potential participants have already entered the crypto market, and this slows down the pace of attracting new users.
Bitcoin Balance by Holdings in USD
The BTC Balance By Holdings in USD metric of the BTC network over the past 30 days shows the following changes:
$0.00 - $1.00: +5.23%
$1.00 - $10.00: +0.39%
$10.00 - $100.00: -0.14%
$100.00 - $1,000.00: +0.51%
$1,000.00 - $10,000.00: +1.37%
$10,000.00 - $100,000.00: +3.68%
$100,000.00 - $1,000,000.00: +4.62%
$1,000,000.00 - $10,000,000.00: +5.47%
$10,000,000.00: +6.85%
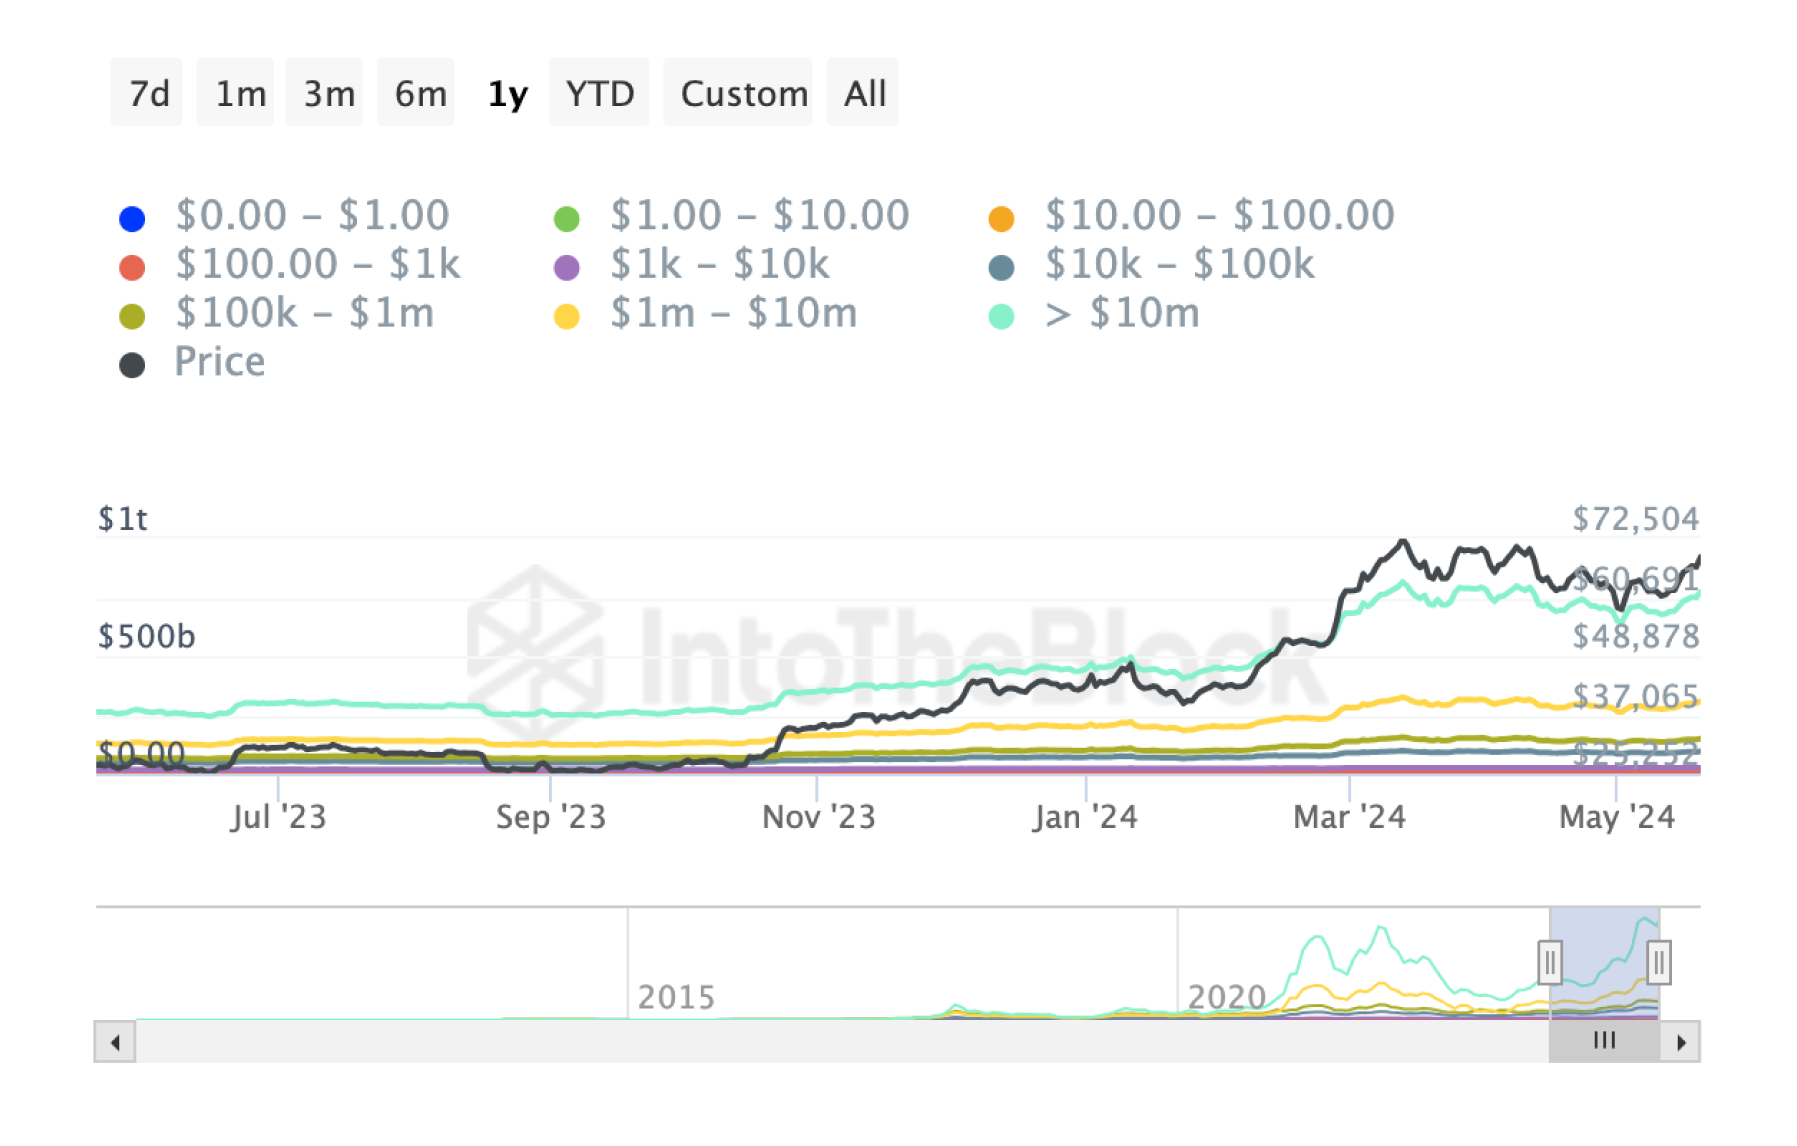
As seen on the crypto chart, these changes indicate growth in balances in all categories in dollar terms. It is important to note that the larger cryptocurrency holders (those with balances greater than $10 million) show the largest percentage increase over the past 30 days. This may indicate that large players are increasing their positions in BTC.
Bitcoin: Stock-to-Flow Model
On-chain data shows that an interesting trend has emerged on the market: major players have become more active, increasing their positions in BTC. This growth is reflected not only in balances, but also in the number of transactions. They are probably guided by the Stock-to-Flow model, using it as a tool for predicting the Bitcoin price.
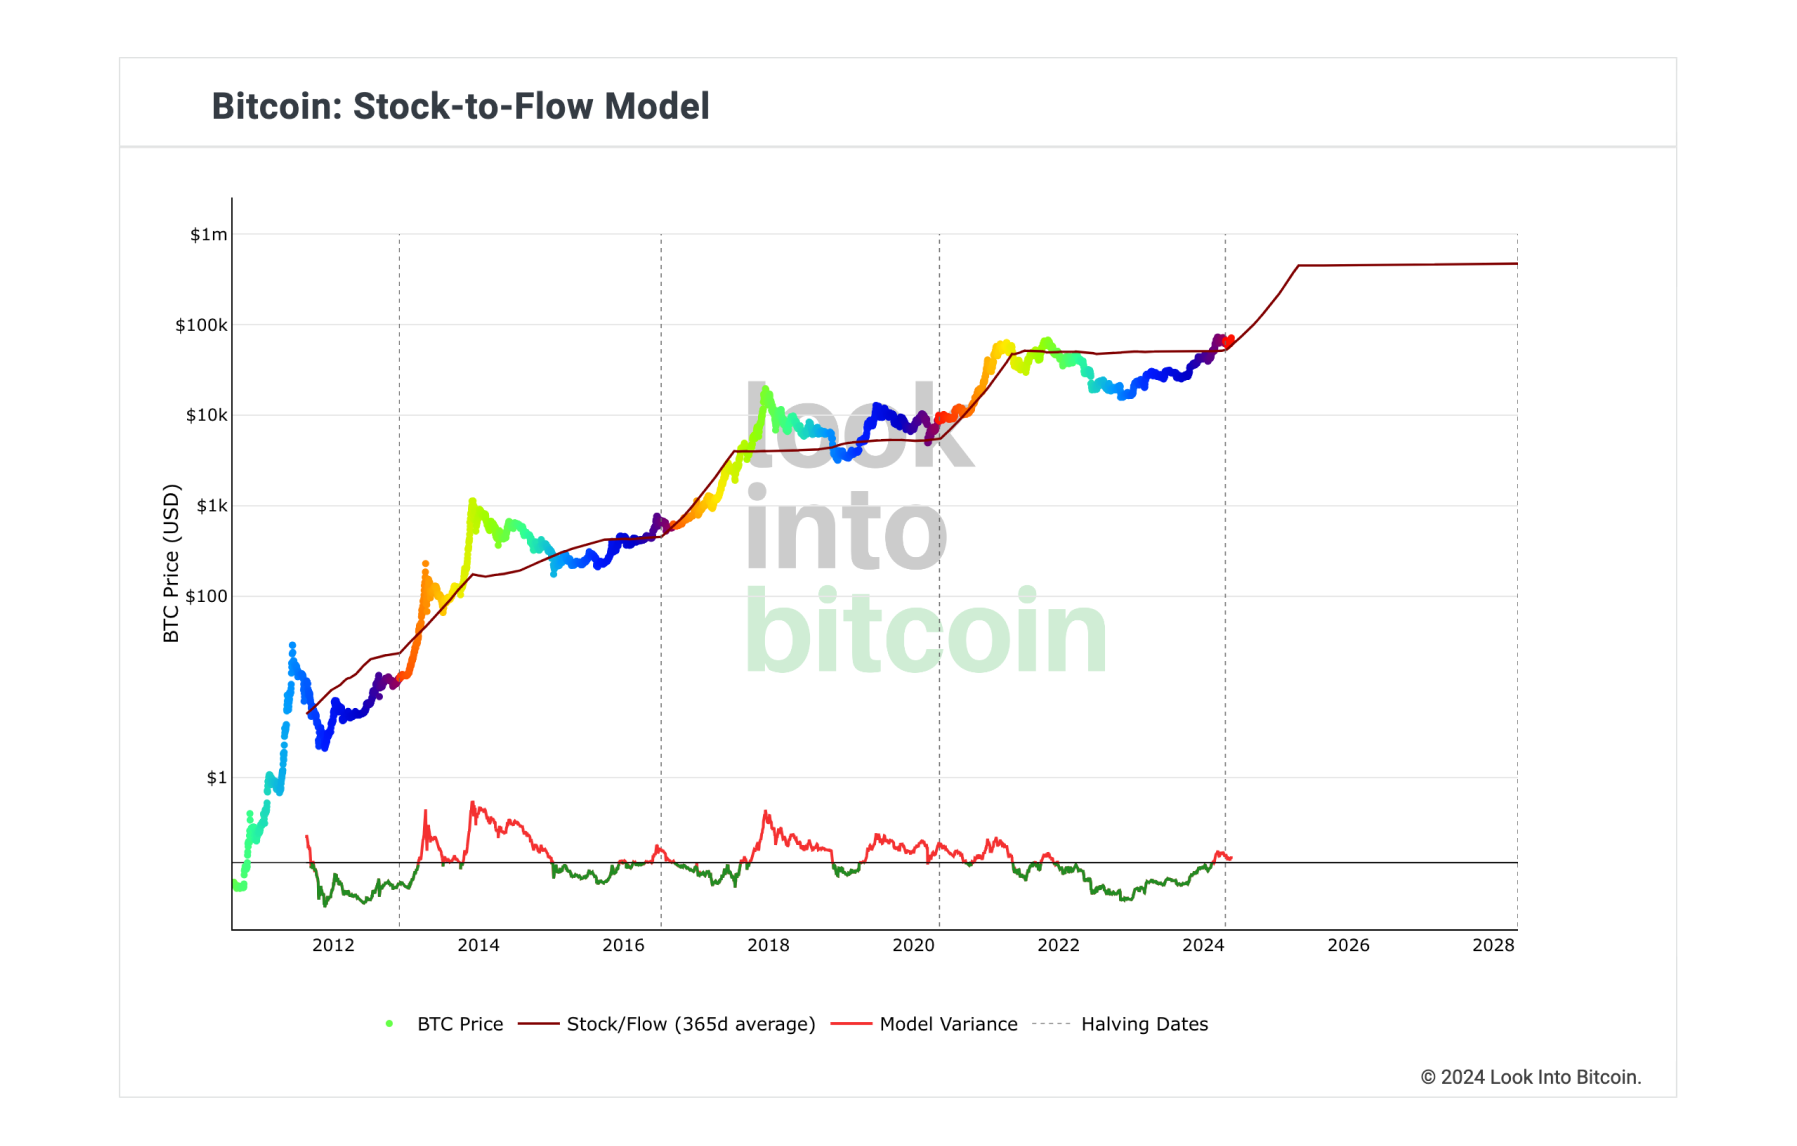
On the graph, you can see a line showing the estimated BTC price level based on the number of Bitcoins available on the market compared to the number produced (mined) each year. This allows to analyze the supply and demand for Bitcoin and draw conclusions about possible price changes in the future.
Users can purchase BTC for fiat or crypto on SimpleSwap.
Summary
In the context of the Bitcoin market, noted is the increased activity of large participants, expressed in terms of an increase in their balance sheets and number of transactions.
Most investors, observing the actions of the big players, may interpret this as a confirmation of Bitcoin stability and future prospects. This may attract more new crypto market participants, including small investors, who may see an opportunity to capitalize on the rising price of the asset.
Also, this on-chain BTC analysis an increase in the number of transactions is often accompanied by an increase in volatility and activity. This can create a favorable atmosphere for more active trading strategies, attracting additional interest in Bitcoin.
The Stock-to-Flow model, given the supply and demand in the market, can be a useful tool for making long-term investment decisions.
The information in this article is not a piece of financial advice or any other advice of any kind. The reader should be aware of the risks involved in trading cryptocurrencies and make their own informed decisions. SimpleSwap is not responsible for any losses incurred due to such risks. For details, please see our Terms of Service.


