Trading Channels Strategy: Bollinger Bands Explained
Key Insights
- Drawing trend lines between successive high and low points allows users to visually define trading channels, providing a framework to analyze price fluctuations.
- A trading channel indicator like Bollinger Bands utilizes standard deviation calculations to plot upper and lower volatility bands around a moving price average, helping traders identify overbought or oversold conditions relative to historical volatility.
- The rising trading channel pattern strategy suggests entering long trades when prices bounce upwards off the lower channel line support level, using RSI divergence as a possible early signal of uptrend weakness.
Technical analysis utilizes a variety of tools and crypto trading indicators to review financial market behavior and identify potential trading opportunities. Chart patterns like trading channels are widely used techniques that can help traders visualize trends and momentum.
By analyzing stock channels, investors seek to capitalize on movements between identifiable support and resistance levels. Two common types of trading channels are Bollinger Bands and Donchian Channels, which define volatility boundaries. Effective channel pattern trading involves identifying the right entry and exit points in line with changes in market direction.
In this article, we will explore the construction and use of some popular trading channels, as well as outline two sample channel trading strategies.
How to Find Trading Channels on a Chart
Trading channels are a concept used in technical analysis of financial markets to describe the movement of price changes between two parallel lines. These lines represent the upper and lower boundaries of the trading channel and serve to define the framework within which asset prices can fluctuate.
Often trading channels are associated with sideways market movement, where prices move within the defined boundaries without making significant changes in direction. However, channels can also serve as a tool for identifying trends if prices move along the channel boundaries in a particular direction.
An important aspect of using stock trading channels is analyzing their width and duration. The width of the trading channel can give an indication of market volatility, while the duration can indicate stability or a change in trend. Traders can use information about trading channels to make decisions about entering or exiting positions in the market, as well as to evaluate possible trend reversal points.
One of the common methods of using trading channels is the breakout strategy, which involves tracking the moment when the price moves outside the set boundaries, which may indicate the beginning of a new trend.
Thus, trading channels are a tool that helps traders analyze market conditions, identify trends and make decisions about trades based on price movements within the set boundaries.
Trading Channels: Highs, Lows, Trend Lines
Several methods can be used to identify trading channels, and it is correct to emphasize two key aspects here: using high and low points, and drawing trend lines. Let's take a closer look at these methods:
- High and Low Points (Extremes)
Trading channel Highs and Lows: Identify the maximum and minimum price values on the chart for a specific time period.
Channel Highlights: Pay attention to pairs of highs and lows between which prices fluctuate. These points can be used to identify the upper and lower boundaries of the stock trading channels.
- Trend lines
Drawing lines: Connect successive highs and lows points using lines. This allows you to visually highlight the direction of price movement to help you build a trading strategy.
Trading channel definition: If the lines drawn through the highs and lows are parallel to each other, you can see trading channels forming.
- Channel Update
Actualization: Update your channels of trading regularly with new price data. This will help you track changes and adapt your trading strategy.
Identifying trading channels requires practice and experience. It is important not only to draw the channel lines, but also to interpret the channel correctly, taking into account the market context and other factors.
Types of Trading Channels
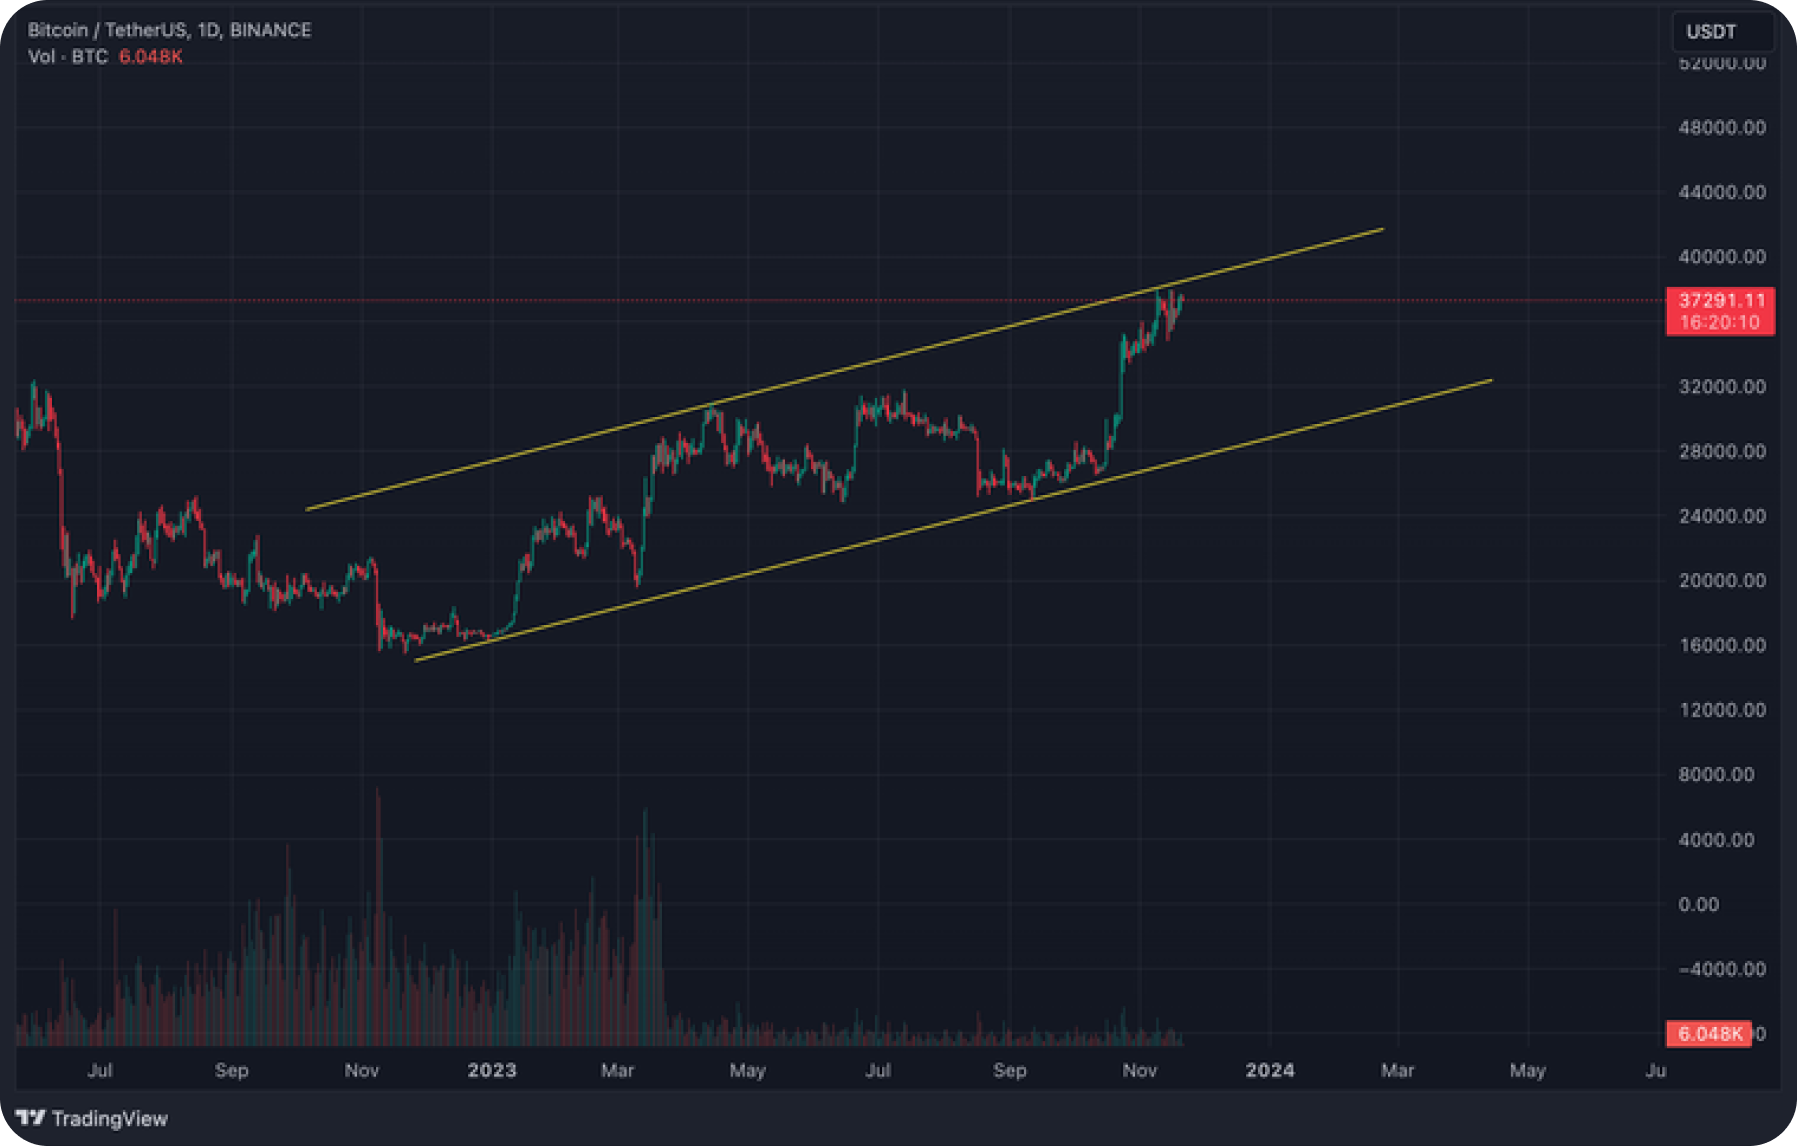
- Ascending channels
Price growth between two parallel lines.
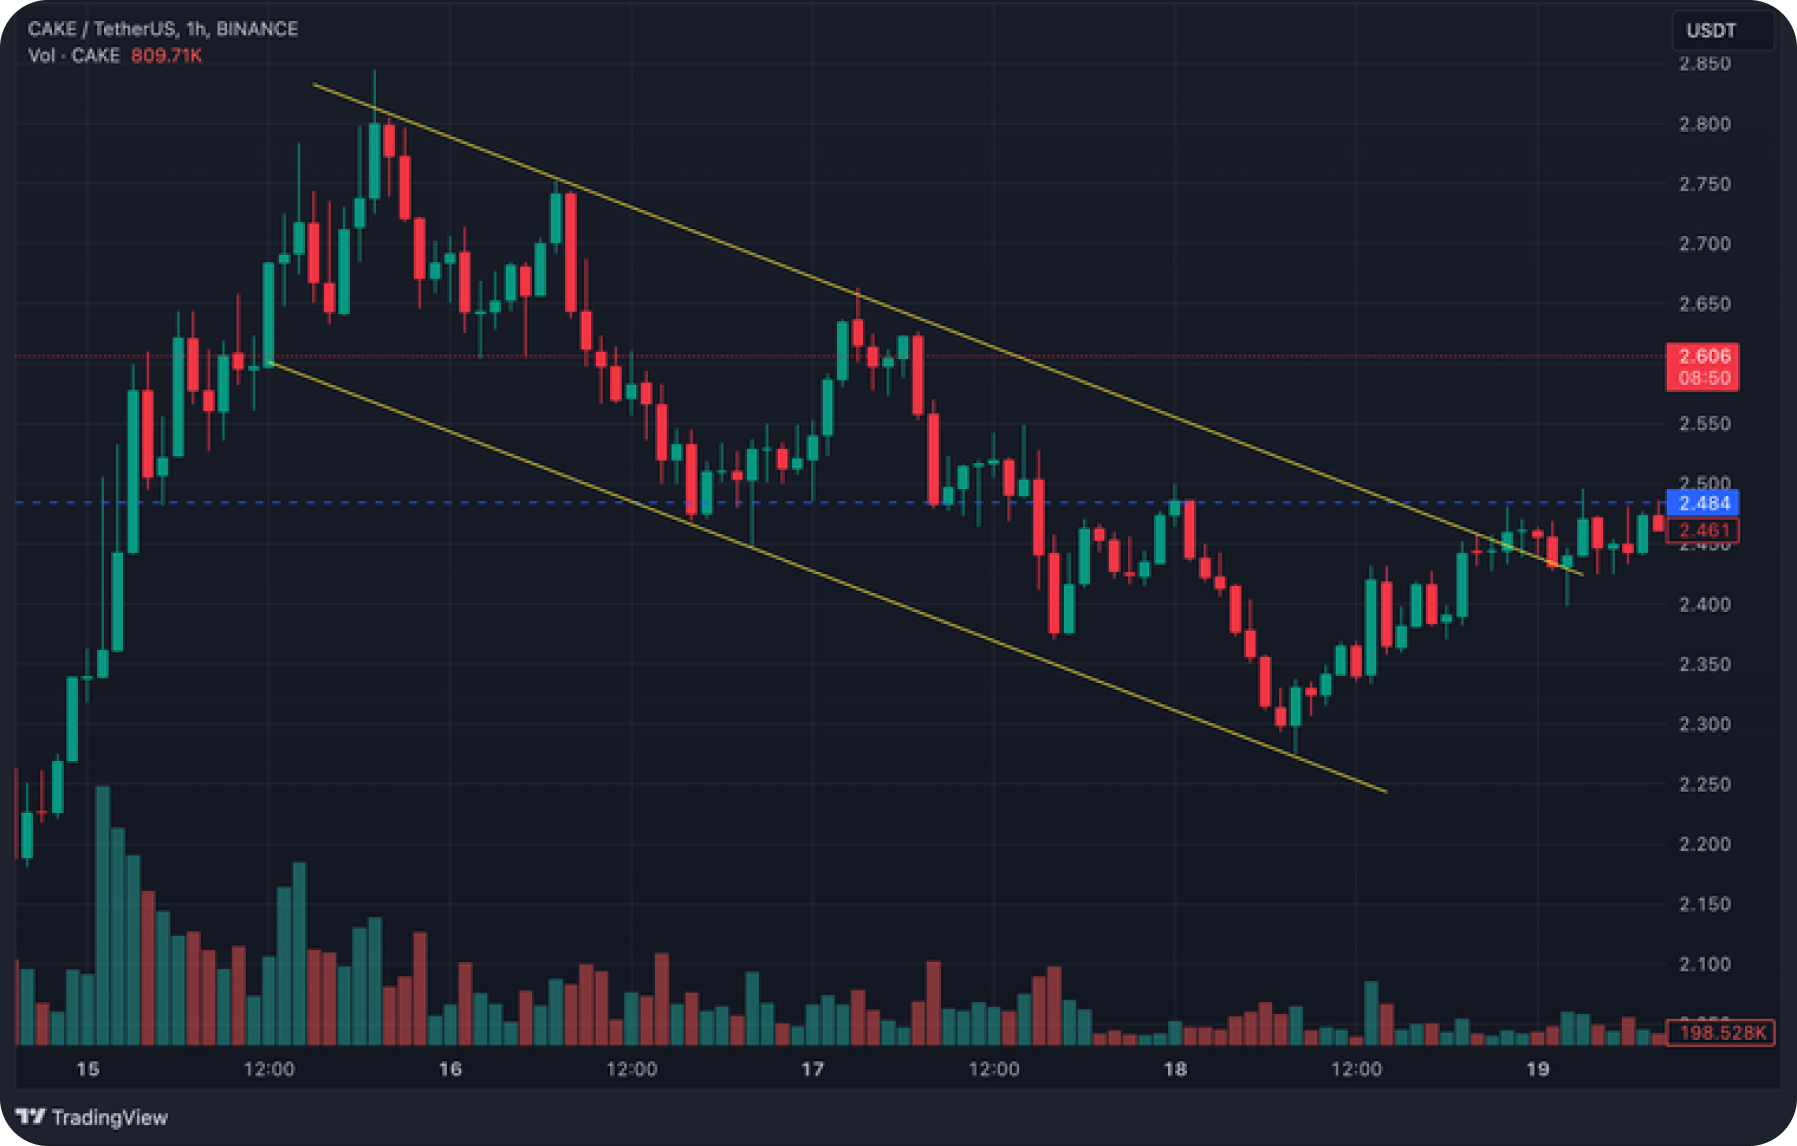
- Descending channels
Decrease in prices within a trading channel.
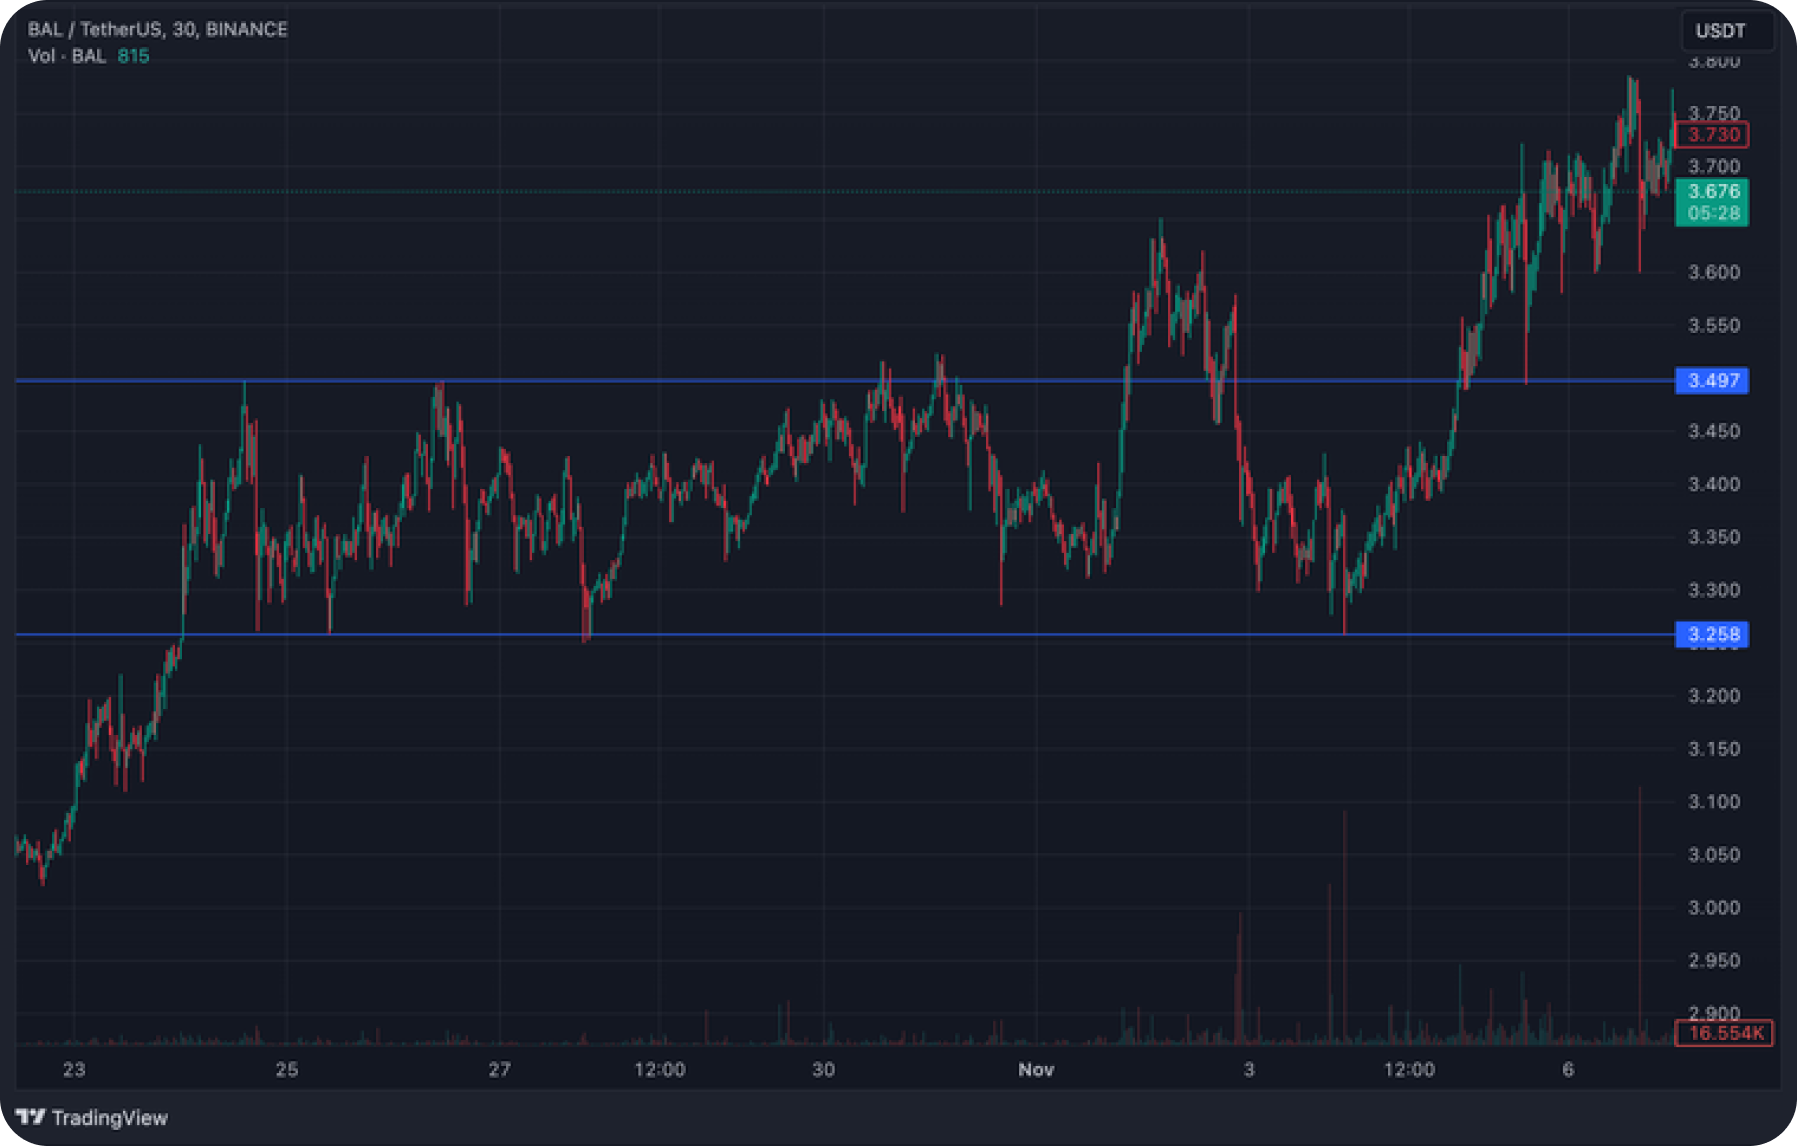
- Horizontal trading channels
Lateral price movement without a distinct trend.
Popular Channel Trading Indicators
Among the variety of instruments used in trading technical analysis, channel indicators occupy an important place.
The three most popular of them are Bollinger Bands, Donchian Channel, and Keltner Channel. They help to determine the levels of support and resistance, assess the volatility dynamics and identify potential reversal zones. Below we will consider their peculiarities in more detail.
What Are Bollinger Bands
To have Bollinger Bands explained, it’s necessary to note that this indicator is a popular technical analysis tool used in financial markets, especially in stock trading. This trading indicator was developed by John Bollinger in the 1980s and is widely used to analyze price volatility and identify potential pivot points in the market.
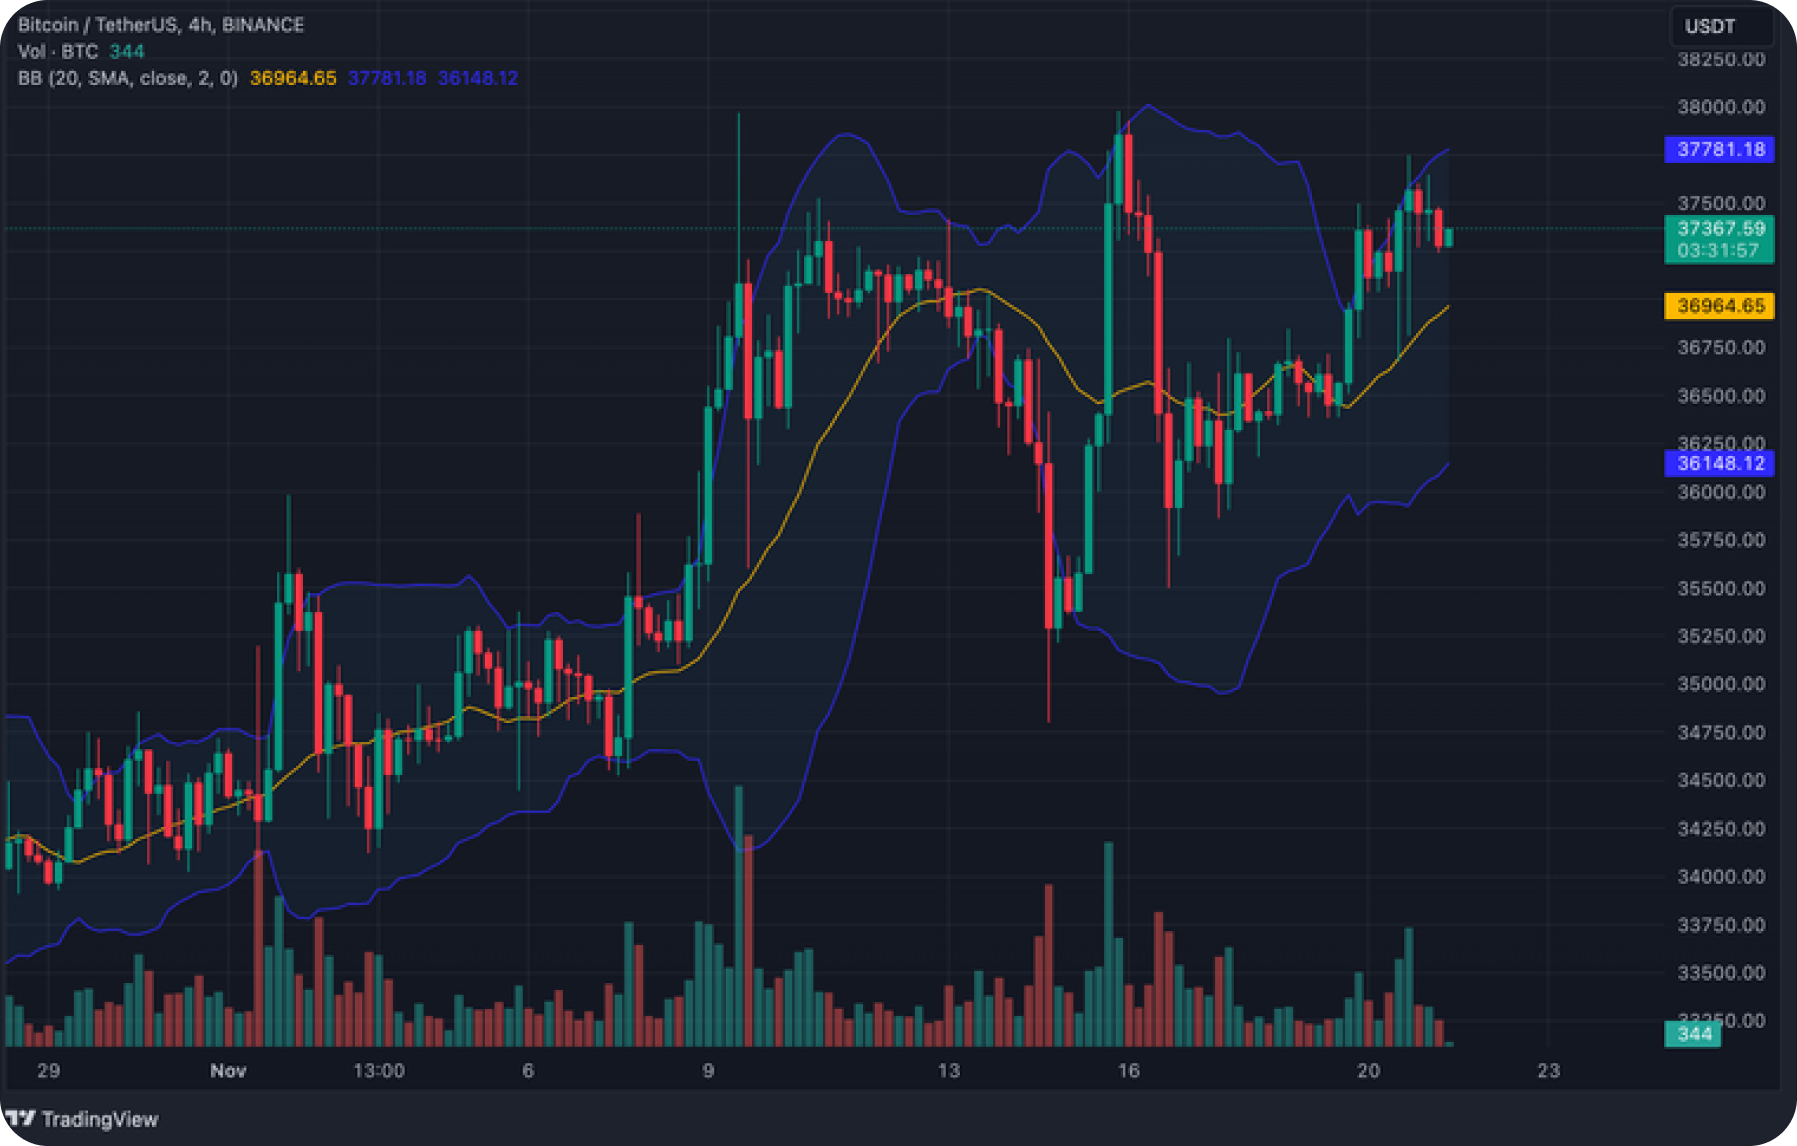
The Bollinger Bands indicator consists of three lines.
- Moving Average (MA)
This is usually a simple moving average (SMA) of closing prices over a specific period. The most common period is 20 days, but traders can customize it according to their preferences.
- Upper Band
Investors use the price channel indicator to analyze movement of stock market value between the Bollinger bands. It is calculated by adding a few (usually two) standard deviations of price movements to the middle Bollinger band. The standard deviation measures the spread of prices from the mean.
The formula for the upper band usually looks like Average Band + (2 * Standard Deviation).
- Lower Band
Similarly, the lower Bollinger band is calculated by subtracting a few standard deviations from the average band.
The formula usually looks like Average Band - (2 * Standard Deviation).
Bollinger bands expand and contract depending on market volatility. It expands during periods of high volatility and contracts at times of low volatility.
Traders use this information to identify potential trend reversals or price breakout opportunities. Channel pattern trading often involves using these bands to spot potential entry or exit points.
What Is Donchian Channel Indicator
The Donchian Channel is a technical analysis tool used to identify potential trend reversals, breakouts and overall volatility of a financial instrument. This tool was developed by Richard Donchian, a futures and commodities trader, in the mid-20th century.
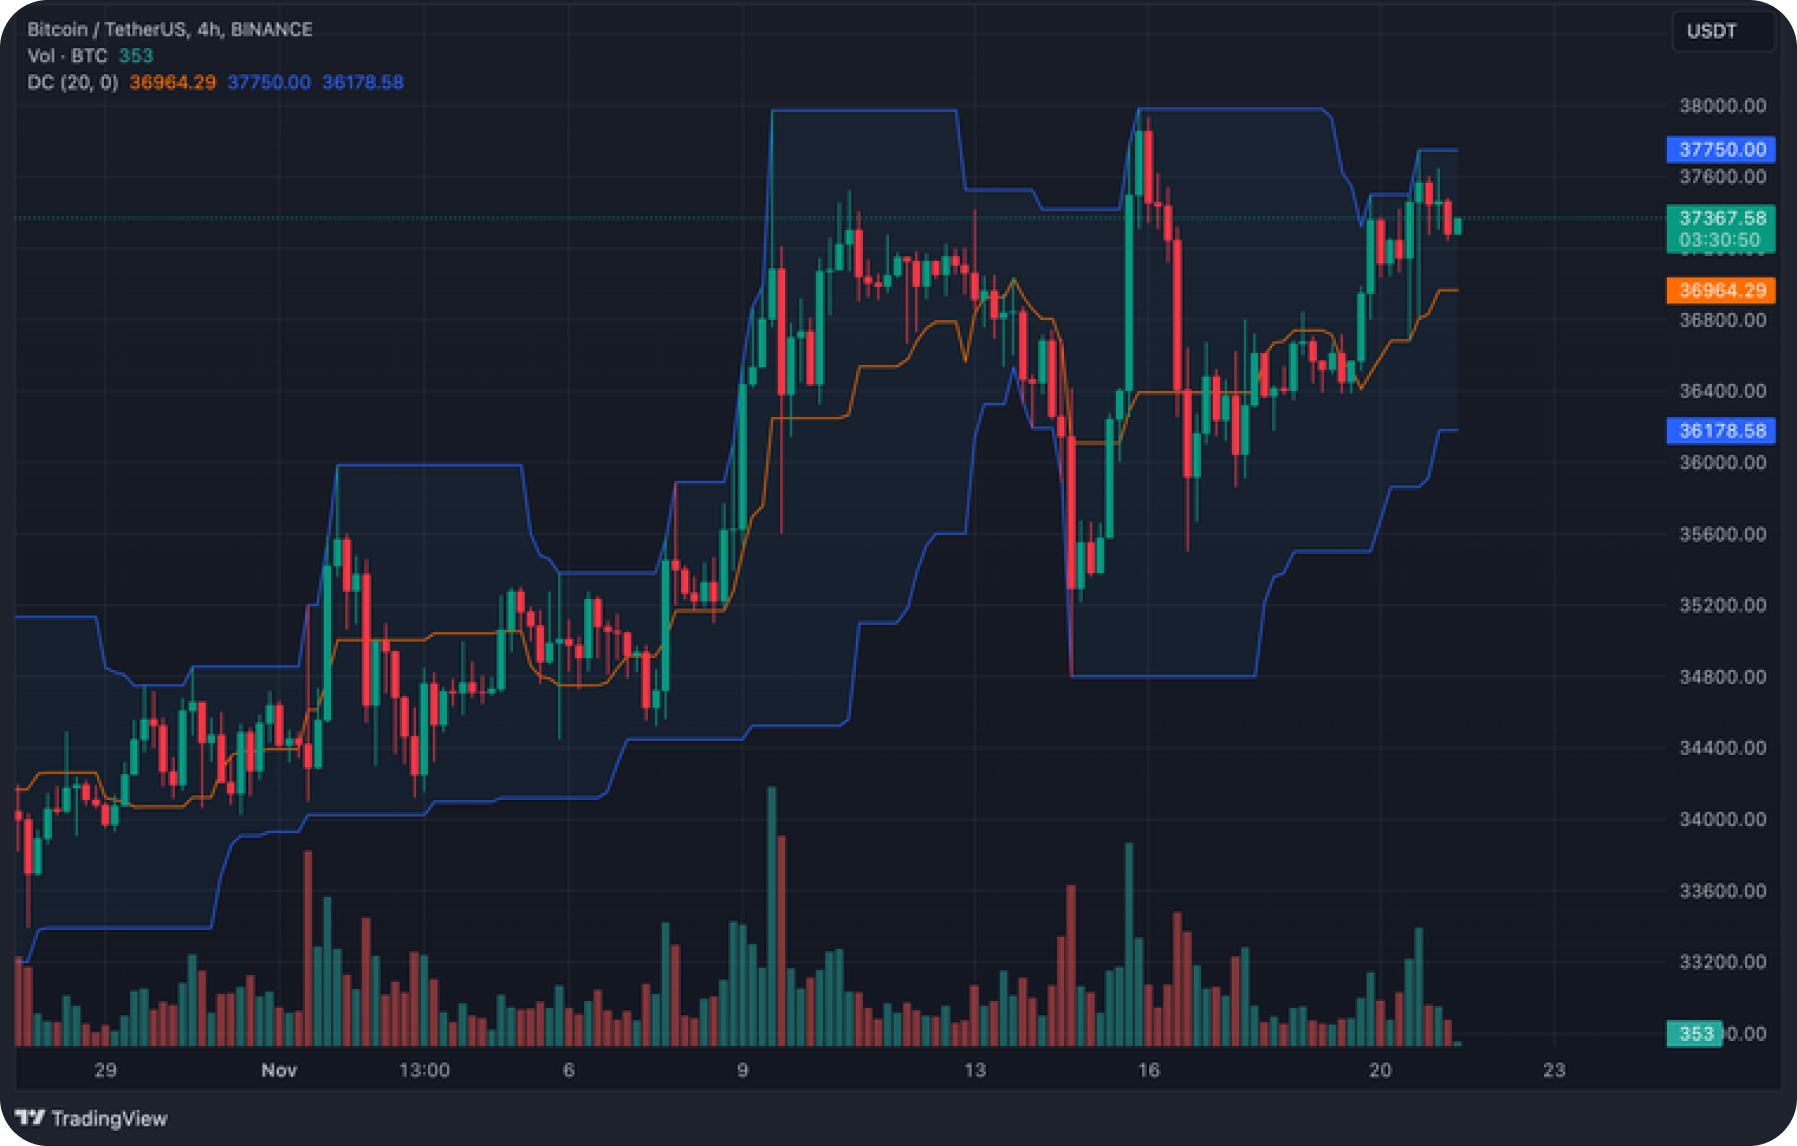
The Donchian Channel trading indicator consists of three lines.
- Upper Band
This is the highest price channel indicator over a specific period, often referred to as the lookback period. The upper bar helps identify the highest price in the recent past.
- Lower Band
On the contrary, the lower band represents the lowest channel pattern trading during the same period. This helps to identify the lowest price in the recent past.
- Middle Band (Average Line)
This is the midpoint between the upper and lower bands.
It is calculated as (Upper Band + Lower Band) / 2.
The basic idea behind Donchian Channels is to identify the current price relative to the highest and lowest prices over a certain period. Users leverage these trading channels not only to detect breakouts and trends but also to identify potential reversal points in a descending/rising channel pattern.
The price channel indicator assists traders in assessing market movements and making informed decisions based on historical price data.
What Is Keltner Channel
The Keltner Channels are a technical analysis tool used in trading to identify potential reversals or trends in financial markets. They were introduced by Chester Keltner in his book named How to Make Money in Commodity Markets in 1960.
The Keltner Channel indicator consists of three lines.
- Moving Average (MA)
This is usually the 20-period exponential moving average (EMA) of the asset price.
- Upper Channel Line
This is usually constructed above the middle line and represents the upper level of volatility. It is calculated by adding twice the average true range (ATR) to the midline.
- Lower Channel Line
This line is constructed below the middle line and represents the lower level of volatility. It is calculated by subtracting twice the average true range (ATR) from the midline.
Average True Range (ATR) is a measure of market volatility. It takes into account the actual range of movement of the asset over a given period, which is the largest of the following values.
- The current maximum price minus the current minimum price.
- The absolute value of the difference between the current maximum price and the previous close.
- The absolute value of the difference between the current minimum price and the previous close.
Keltner channel pattern trading is often used to identify overbought or oversold market conditions. Traders can watch for the price to touch or exceed the trading channel up pattern, indicating overbought conditions, or to touch or fall below the lower channel, indicating oversold conditions.
Some users also look for divergence/convergence between price movement and channel lines as a signal of a potential trend reversal.
Ascending Channel Trading Strategy
Trading in different types of stock channels is a cryptocurrency trading strategy aimed at making successful trades in the financial markets based on the characteristics and dynamics of price movements within certain channels.
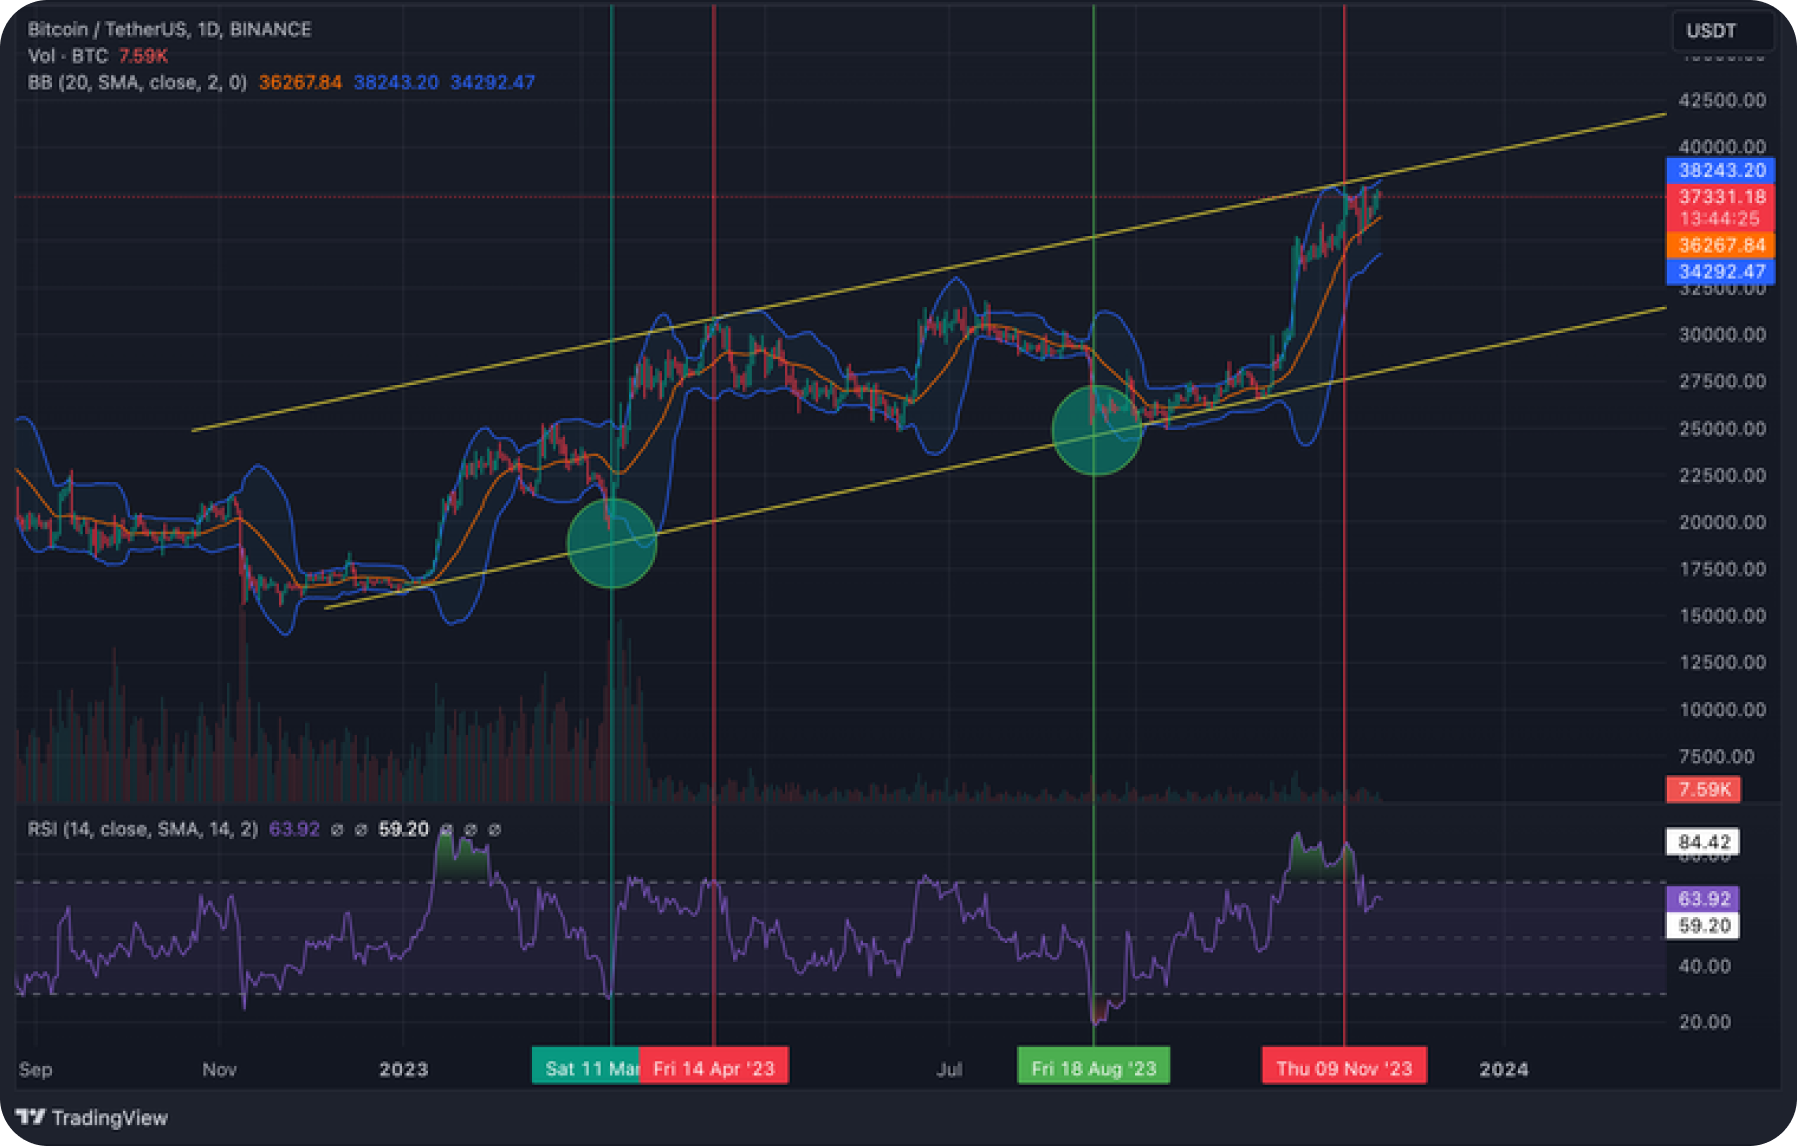
This channel trading strategy includes:
- Position entry points in an ascending channel pattern
Traders look for entry points at support levels (lows) when the price approaches the lower line of an ascending channel. This can be considered a time when the asset is potentially overbought.
Buy trades are opened when the price starts to rise from the lower channel line. This may indicate the start of a new upward movement.
- Using RSI (Relative Strength Index) for confirmation
The RSI can serve as an additional confirmation of trend strength. If the price rises and the RSI also shows increasing strength (but does not reach overbought levels), this can reinforce confidence in the uptrend.
Pay attention to divergences between RSI and price, such as a downward divergence in a strong uptrend, which can be a warning of a possible trend change.
Investors employ the channel indicator to determine potential support and resistance levels for entering and exiting trades. A successful channel trading crypto strategy is based on identifying the boundaries of the chart and trading within them.
Bollinger Bands Strategy
Finding Entry Points
When price touches or breaks through the upper Bollinger Band, it may indicate that the asset is overbought. This can be a signal for a trader to consider closing long trading positions or even opening short positions, suggesting a possible decline in price.
When the price touches or breaks the lower Bollinger Band, it may indicate that the asset is oversold. This may encourage a trader to consider closing short trading positions or even opening long positions, suggesting a possible increase in price. The channel indicator helps in detecting trend continuation and reversal signals.
Combining With Other Indicators
Traders often combine Bollinger Bands indicator with other technical indicators to refine entry and exit signals. For example, they may use overbought/oversold indicators such as RSI to confirm market conditions.
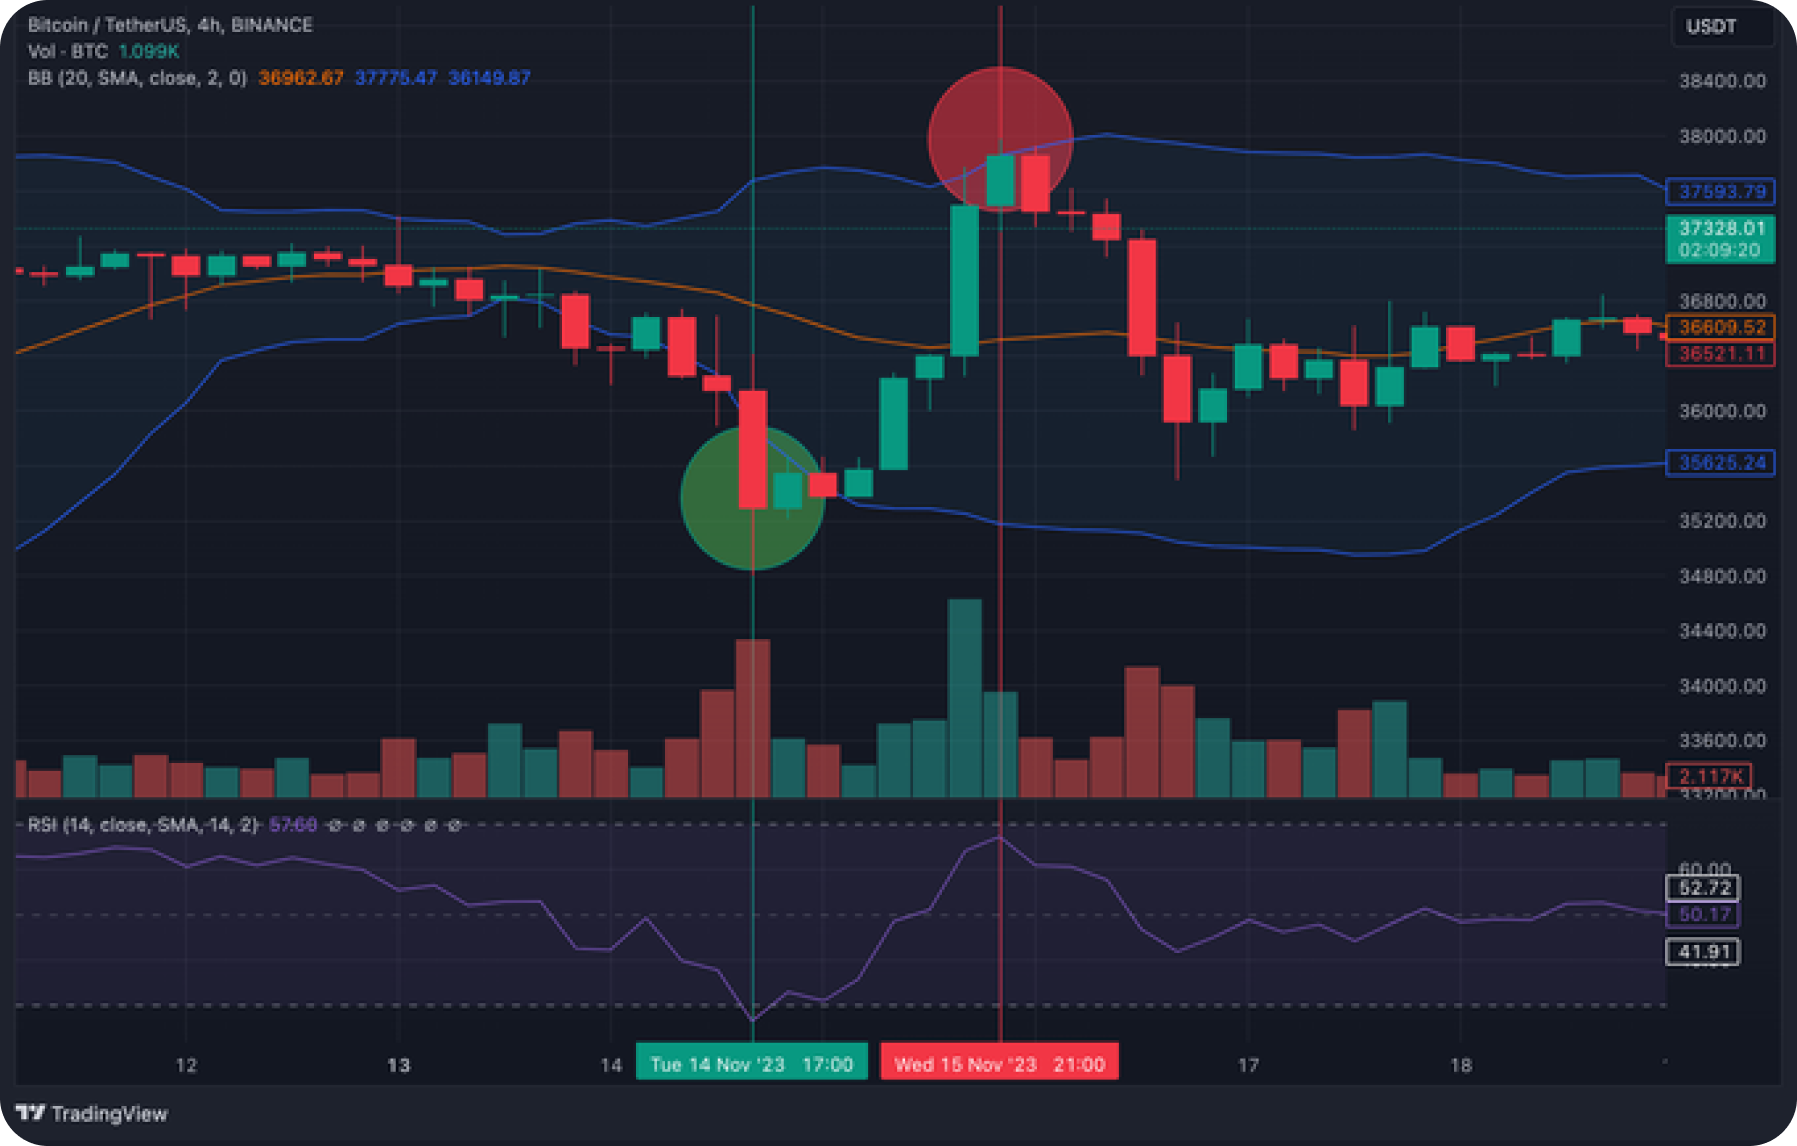
Besides, traders can pay attention to candlestick patterns and other technical signals to reinforce their decisions when using Bollinger Bands. Incorporating channel pattern trading can provide additional confirmation for potential trade setups.
Summary
We have reviewed two effective trading strategies based on the use of technical analysis and crypto indicators.
The rising channel strategy focuses on identifying entry points within an ascending channel, emphasizing the importance of analyzing support levels and using RSI to confirm trend strength.
The Bollinger Bands strategy suggests entry points based on touching the upper or lower bands, emphasizing the overbought or oversold nature of the asset. Combining Bollinger Bands with other indicators such as RSI improves the accuracy of the signals.
Both crypto strategies provide traders with the tools to make informed decisions based on analyzing price movements and trend strength indicators.
It is important to remember that successful trading requires constant market analysis, adapting strategies to changing conditions and considering risk. Investors can use these trading strategies as a starting point and customize them according to their own style and preferences.
Users can purchase crypto assets of their choice for this strategy on SimpleSwap.
The information in this article is not a piece of financial advice or any other advice of any kind. The reader should be aware of the risks involved in trading cryptocurrencies and make their own informed decisions. SimpleSwap is not responsible for any losses incurred due to such risks. For details, please see our Terms of Service.


