



SimpleSwap H1 2026 Report: The half crypto stopped flinching

Updated: Aug 19, 2026

Introduction
This is half the market that stopped reacting.
In February, Bitcoin dropped 17.5% in 36 hours, and traders rushed for cover. Stablecoin inflows across our platform surged 600% above their weekly average in a single day. In June, Bitcoin fell 15.7% over 70 hours — a nearly identical drop in depth; and the same flows moved 9% in the opposite direction. Nothing happened. The market saw the same event twice and barely reacted the second time. Market-wide sentiment gauges tell the same story. The Crypto Fear & Greed Index hit an all-time low of 5 during the February drop and only climbed into the low teens in June.
That contrast shapes the first half of 2026, and this time we read it differently. A single aggregator is a sample of the market, not a measure of it, so every figure below starts with a public benchmark, with sources named in the methodology. Our own data comes second, either confirming the benchmark or diverging from it. Where it diverges, we treat that as a fact about our product and audience, and we say so.
We publish this because swap data occupies a unique vantage point. Every swap is a decision to leave one asset and enter another, captured at the moment it is made. Order books show what people are willing to pay; swaps show what they actually did next. That vantage point is narrow by design. It covers the people who choose an aggregator, and the benchmarks in this report are meant to show exactly where their behavior diverges from the market’s.
Everything below is aggregated and relative. We report shares, ratios, correlations, and rates of change rather than dollar totals, both because no single platform’s absolute volume defines a market and because no reader needs it to follow the argument.
Now for the findings.
Key takeaways
- The market halved; our platform fell by a third. Spot volume on the top centralized exchanges dropped roughly 51% against H2 2025 by CoinGecko’s count, while our volume fell 33.9% and transaction count only 18.5%. The audience stayed and brought smaller amounts.
- The fear trade stopped working. Our stablecoin flows tracked Bitcoin closely from January through March and stopped from April onward. Market sentiment faded the same way: the Fear & Greed Index printed an all-time low of 5 in February and only the low teens during June’s near-identical drop.
- Stablecoins were the only thing that did not shrink. Market-wide, supply remained near $310 billion while total crypto capitalization fell by about 30%. On our platform, every month of the half ended with a net inflow into dollar-pegged assets.
- The long tail of networks is the main channel. 91.8% of swaps crossed a chain boundary, and 71.4% touched a network outside the four largest. Industry cross-chain volume has increased roughly 100x since 2022, so the market is moving in our direction.
- Coverage runs ahead of demand. 268 assets were added, and the median one waited 48 days for its first user. Being routable before anyone asks is the point.
- The market hid in Bitcoin; our users kept leaving it. Bitcoin dominance broke above 60% during the half, while the BTC and ETH share of our volume fell 5.2 points to 43.4%. An aggregator records rotation, and this audience rotated toward dollar routes and the long tail.
The half in five numbers
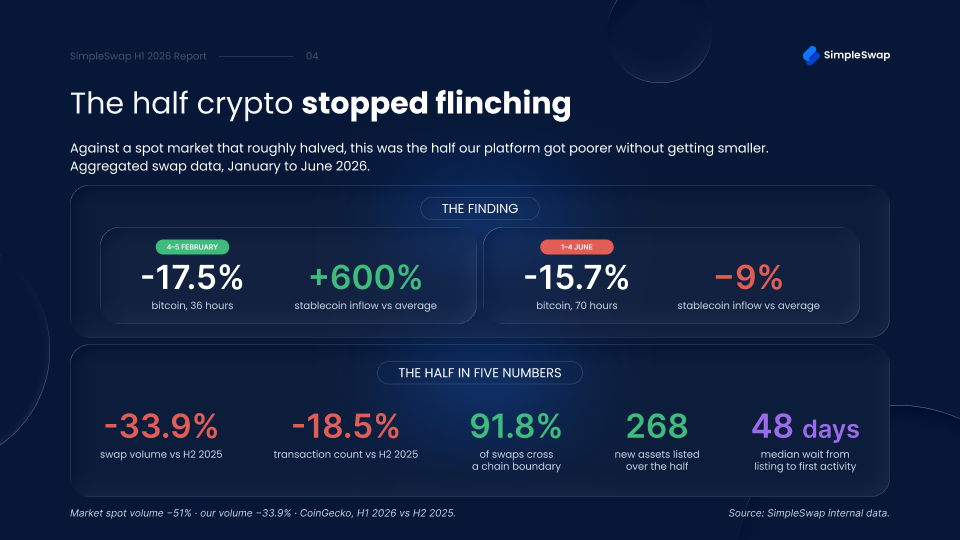
Against a spot market that roughly halved, this was the half our platform got poorer without getting smaller. Money contracted by a third. People contracted by a fifth.
Methodology
The reporting period runs from 1 January to 30 June 2026, benchmarked against the second half of 2025.
This edition changes the method. SimpleSwap data describes SimpleSwap’s audience; it is a sample of the market, not an index of it. Each section therefore opens with a public market benchmark before any internal figure appears. Exchange volumes and market capitalization are taken from CoinGecko’s quarterly industry reports. Stablecoin supply and settlement are read from DeFiLlama and from Visa’s Allium-powered dashboard. Sentiment references the Alternative.me Fear & Greed Index, and cross-chain context draws on LI.FI and Circle disclosures. Internal figures follow, and every divergence from the market is labeled as a trait of our product or audience rather than as a trend.
All figures are aggregated across swaps routed through SimpleSwap. Nothing in this report identifies a user, an address, or the timing of an individual transaction.
One dollar figure appears in the text, and only as a measurement boundary rather than a platform total: the fixed threshold used to define a new listing’s first meaningful activity. It is identical across all assets, which is what makes them comparable.
This report describes past market behavior. It is not investment advice and contains no price forecasts.
Act I. The market halved, the platform fell by a third
Start with the market. Spot volume on the top centralized exchanges fell from about $9.5 trillion in H2 2025 to $4.65 trillion in H1 2026, a drop of roughly 51%, with March and May printing the lowest monthly readings since late 2023, according to CoinGecko. DEX spot turnover slid in step, from about $231 billion in January to $178 billion in June. Total crypto market capitalization ended the half near $2.1 trillion, about 30% below where it started the year and roughly half of the October 2025 peak.
Swap volume fell 33.9% against the previous half. Transaction count fell 18.5% over the same window. The average swap size, which follows from those two, fell by 18.9%.
The median swap fell 17%, almost exactly in step with the average. That matters: had the half thinned out because the largest users left, the average would have dropped much further than the median. It did not, so the contraction ran evenly across the whole distribution rather than concentrating at the top.
Bitcoin itself lost about 35% over the period, measured from its January high to its low in the final week of June, and CoinGecko puts the asset’s Q1 decline alone at 22%. Price and market turnover pointed in the same direction as our own throughput, at different depths, which is what a cyclical contraction looks like from inside one venue.
The set of assets people actually used barely moved: 1,333 traded in H1 2026, compared with 1,392 in H2 2025, a decrease of 4.2%. The routes between them thinned out much faster, from 21,138 active pairs to 17,857, a decrease of 15.5%. Traders kept almost the entire vocabulary and built fewer sentences from it — the average asset appeared in 13.4 pairs, down from 15.2 six months earlier.
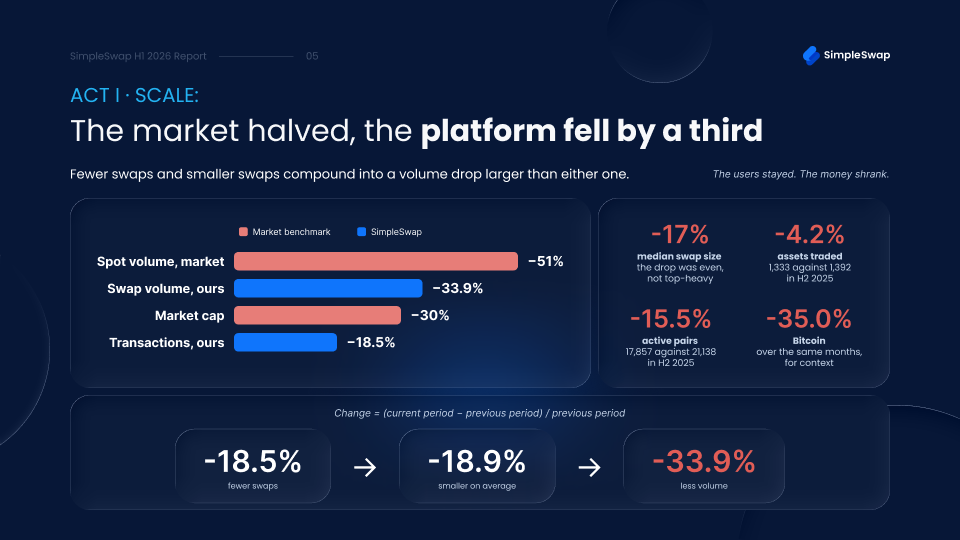
What does it mean? This half was not about an audience leaving, nor was it about a product losing its clients. The same audience transacted in smaller amounts inside a market that halved its turnover. Two things point that way: the decline ran 17 points shallower than the benchmark’s, and it ran evenly, with average and median swaps falling in step while the range of assets in use held nearly steady. A market losing interest drops assets. This one kept them and used them less often.
Act II. Two markets share one platform
Seven of the ten largest routes run through one asset.
The top ten pairs by volume account for 28.3% of all turnover. The top ten pairs by transaction count account for only 18.8% of all trades. Large money travels a narrow set of routes while small money scatters across a tail of nearly eighteen thousand pairs.
The two lists barely overlap. Of ten positions, three routes appear on both. The other seven entries on each list are unique to it.
Net balance by asset shows the direction of the half, calculated as the difference between an asset’s share of received volume and its share of sent volume.
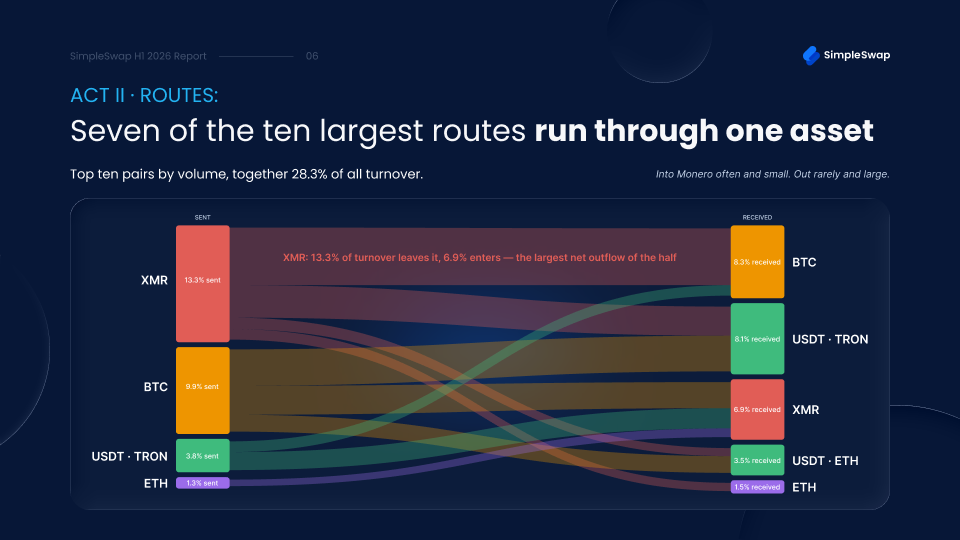
Bitcoin and Ether together accounted for 43.4% of volume, down 5.2 points from the previous half, with everything else making up the remaining 56.6%.
Against the market: the Bitcoin divergence
Market-wide, the half belonged to Bitcoin. Its dominance broke above 60% in the spring and held elevated into June, while the Altcoin Season Index spent the period pinned in Bitcoin territory. Capital that stayed in crypto consolidated into the largest asset.
Our flows ran the other way. The combined BTC and ETH share of platform volume fell 5.2 points to 43.4%, and Bitcoin’s net balance was slightly negative. The largest single net gainer of the half was USDT on TRON, up 6.0 points.
The two pictures are not in conflict; they describe different instruments. Dominance measures where value sits. An aggregator measures the moment value moves. People hold Bitcoin on the market’s books and come to a venue like ours when they rotate it out of the market into dollar liquidity or the long tail. Read together, the benchmark and our table say the market held its Bitcoin while its most active slice kept converting theirs.
What does it mean? Divergence from the benchmark is information about the audience, not a contradiction in the data. Our users skew toward rotation, mostly out of majors and into dollar liquidity on cheap rails. For partners who integrate us, that is the profile being served.
Act III. Stablecoins became a route, not a destination
Supply stood still, movement set records
Stablecoins have spent most of crypto’s history as a parking space. In the first half of 2026, the market’s data and ours agree that they did something else.
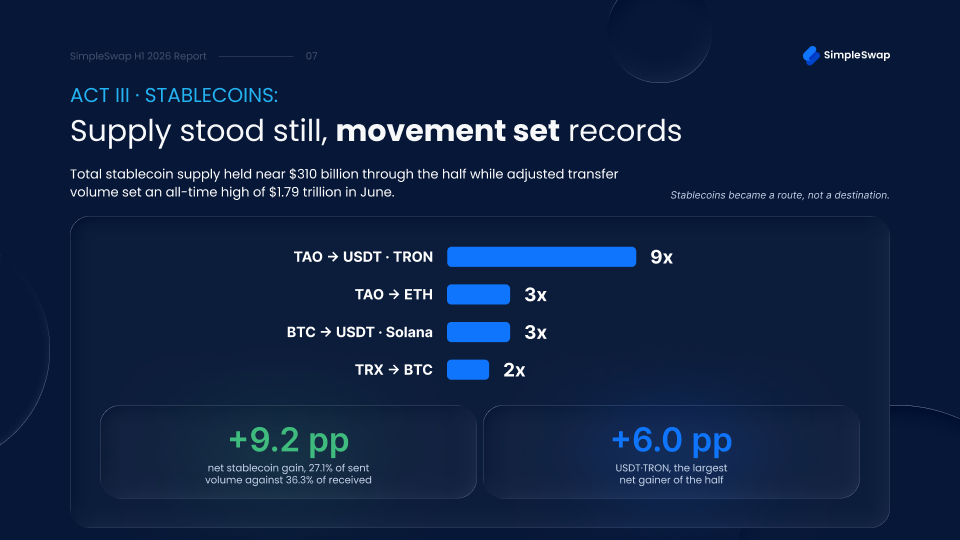
The market frame first. Total stablecoin supply held near $310 billion through the half, ending Q1 at $309.9 billion and Q2 at $305.1 billion by CoinGecko’s count, a move of under 2% inside a market that lost about 30% of its capitalization. Settlement told the sharper story. Visa’s Allium-powered dashboard recorded $1.79 trillion of adjusted stablecoin transfer volume in June, an all-time high that stands 125% above the year before, and the previous record had been set in February. Supply stood still while movement set records, which is the signature of infrastructure rather than of a position.
Start with the destination view, which still holds. Adding up every dollar-pegged asset in the top ten, stablecoins accounted for 27.1% of sent volume against 36.3% of received volume, a net gain of 9.2 points. More money ended a swap in a stablecoin than started one there, and that was true in every month of the half.
The single largest net gainer in the entire report is USDT on TRON, up 6.0 points. Dollar liquidity on a low-cost chain absorbed more inbound volume than any other asset.
Route-level growth points the same way. Two of the four fastest-growing routes of the half ended in a stablecoin on a low-cost chain, with TAO into USDT on TRON growing about 8.5 times and Bitcoin into USDT on Solana about 2.6 times. Both are measured from small bases, so they indicate the direction the interest moved rather than where the volume sits. The destination in each case is dollar liquidity somewhere cheap to move from, which is the same point every other figure in this section makes.
The other notable feature of stablecoins this half is how little their share changed. The proportion of volume flowing into stablecoins stayed between 53.90% and 60.10% across all six months, a total range of 6.2 points. Over 26 weeks, only two recorded a net outflow.
A constant that narrows is not a sentiment gauge. It is a baseline.
That reading matches what market researchers now measure directly. Adjusted transfer data for 2026 shows settlement volume setting records in the same months that supply moved sideways, a divergence analysts attribute to payments and cross-chain movement rather than trading. Our swap-level data points in the same direction from within the trade itself: dollar-pegged assets function as the rails between chains rather than as a position anyone is taking.
What does it mean? The interesting question about stablecoins is no longer how much sits in them. It is how often they move and along which rails. Market settlement data now answers that directly, and our flow table sits on the receiving end of the same shift: more value ended a swap in a dollar than started in one, in every month of the half.
Act IV. The fear trade stopped working
Stablecoin flows tracked Bitcoin for three months — then the signal stopped working
This is the central finding of the report.
For the first three months of the half, the relationship between Bitcoin’s price and stablecoin inflows behaved the way the textbook says it should. The correlation between weekly net stablecoin flow and the level of bitcoin was −0.54 from January through March. Price down, money into safety.
From April through June, the same coefficient reads +0.18. The relationship did not weaken. It disappeared.
The monthly view shows where the break happened.
| Month | Change in BTC | Share of volume in stablecoins | Shift |
|---|---|---|---|
| January | — | 54.33% | — |
| February | −21.8% | 59.25% | +4.92 pp |
| March | −4.6% | 60.10% | +0.85 pp |
| April | +8.0% | 57.53% | −2.57 pp |
| May | +6.4% | 54.46% | −3.07 pp |
| June | −19.0% | 53.90% | −0.56 pp |
Five months out of six behave logically. June breaks the pattern, delivering a drawdown of nearly February’s depth with no flight to safety at all.
Individual episodes make the contrast sharper.
| Episode | BTC move | Stablecoin flow response |
|---|---|---|
| 4–5 February | −17.5% over 36 hours | +600% vs. average |
| 6 February | +13% over 18 hours | −218% vs. average |
| 3–4 March | +10% over 27 hours | −4% vs. average |
| 1–4 June | −15.7% over 70 hours | −9% vs. average |
The February and June episodes differ in depth by less than two percentage points. They differ in response by more than six hundred.
The market’s own sentiment gauges traced the same fade. During the February episode, the Crypto Fear & Greed Index printed 5, the lowest reading in its history. During the June episode, a drawdown of nearly identical depth, it bottomed in the low teens and never approached the February extreme. By Alternative.me’s count, the index spent roughly two of every three days of the half in Extreme Fear, so the June calm was not a sunny backdrop; it was fatigue inside a fearful market. Our flows and the market’s mood ran the same curve.
An independent aggregator points the same way. SwapSpace tracked its own stablecoin inflows around both episodes: 61% above baseline on 4–5 February, fading to 9.3% below baseline by 1–4 June, a smaller spike than ours in February that closes to within half a point of our own reading by June. Their weekly correlation between Bitcoin’s level and stablecoin flow moved from −0.33 in the first quarter to +0.04 in the second, according to Ryan Martin, SwapSpace’s Chief Product Officer. That is the same flip from negative to positive our own shift already showed, from −0.54 to +0.18.
Swapzone’s numbers agree in February and complicate in June. Stablecoin swaps there ran more than 50% above a normal week during the first episode, in step with SwapSpace and our own platform. June was softer: a few individual stablecoins pulled back against a normal week, even as Swapzone’s total stablecoin volume stayed more than 10% above baseline. Both aggregators confirm the surge. Only SwapSpace confirms the fade.
The weekly view adds the closing detail. Across the entire half, only two weeks produced a net outflow from stablecoins. One was the first week of January. The other was the first week of June, which contained the deepest Bitcoin drawdown of the period. In the market’s worst week, money did not arrive in the safe asset. It left.
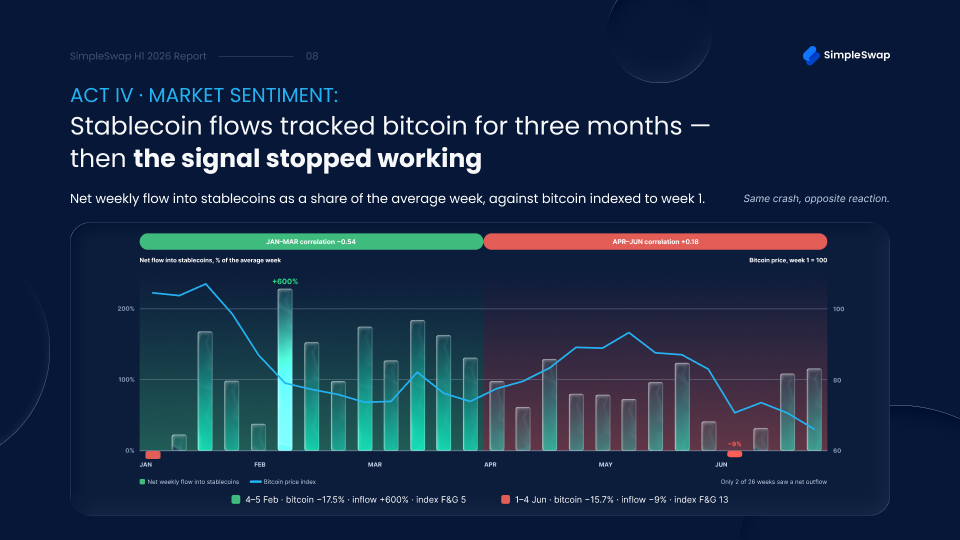
What does it mean? Panic has a half-life. The first drawdown of the half produced a sixfold surge into safety, and the third drawdown of comparable size produced nothing. Swap flows worked as a thermometer of market sentiment for exactly as long as falling prices still counted as news. Sentiment indexes read the same way, which moves the claim from a platform observation to a market one; the partner cross-checks below would complete that move.
We state this strictly as a description of behavior that has already happened. It implies nothing about where prices go next.
Act V. We list ahead of demand
The working hypothesis was that the market quickly picks up new assets. It does not, and the gap between how fast we can list and how slowly demand arrives is worth looking at directly, because it describes the job rather than a disappointment.
268 assets became routable over the half, roughly ten every week. The median one waited 48 days for its first meaningful activity, measured to a fixed threshold applied identically to every asset.
Those two numbers describe two different clocks. The first is ours, and we control it. The second belongs to the market, and no venue controls it. An aggregator cannot know in advance which asset will find an audience, so the only workable position is to be routable before the question is asked.
The asymmetry favors listing early. Carrying a route that nobody uses costs almost nothing, since it is a path rather than an inventory position. Not carrying a route when someone needs it costs a user, and for a business integration, it can cost a partner. Forty-eight days of waiting is a small price to pay to eliminate that failure mode.
When demand does arrive, the infrastructure picks it up immediately. The fastest asset in the half reached its first activity in 101 hours, or 4.2 days. The five quickest launches all landed between 4.2 and 6.5 days, each within a week. Between the fastest asset and the median, there is a spread of roughly 11 times, reflecting how unevenly attention is distributed across new tokens rather than how quickly a venue can move.
Memecoins are the clearest divergence between our audience and the market. In the market, the segment stayed loud through the half: launchpad activity hit record daily volumes in early January, and at the February peak, a single launchpad accounted for roughly half of Solana’s weekly DEX turnover. On our platform, the same segment accounted for 1.1% of volume and 1.4% of transactions. The ratio between those two shares puts the average memecoin swap at roughly 79% of the platform average. That gap is not evidence that memecoins faded; it is evidence of who swaps here. For a venue whose business runs through wallets and other integrations, an audience that focuses on majors and long-tail routes rather than the most speculative corner of the market is a feature, not a gap.
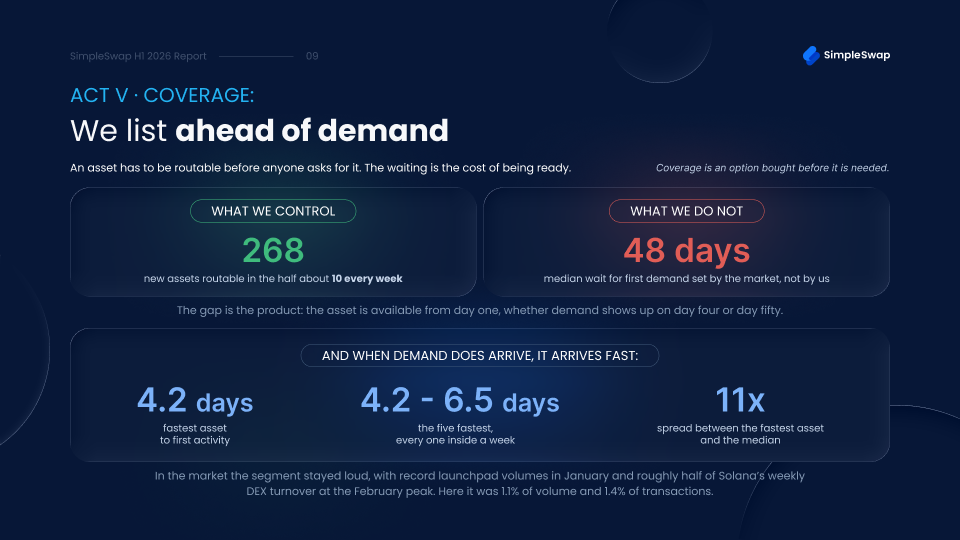
What does it mean? Catalog length is not a shop window; it is an option bought before anyone needs it. The median new asset waits about seven weeks for its first user, and the right response is to keep listing rather than stop. The cost of waiting is near zero, and the cost of missing is a user who goes somewhere else.
Kuvi.AI, still in private beta, offers a partner’s perspective on the same pattern rather than a hard number. Their own read is that new listings generate curiosity on arrival, but the team is careful not to claim that users consistently chase a newly listed asset once live activity is measured, the same gap between attention and follow-through this section describes on our own platform. Kuvi.AI also flags a separate shift worth watching: growing use of automated, user-built trading strategies, described as a step toward giving individual traders tools once reserved for professional desks.
Act VI. The long tail of networks is the main channel
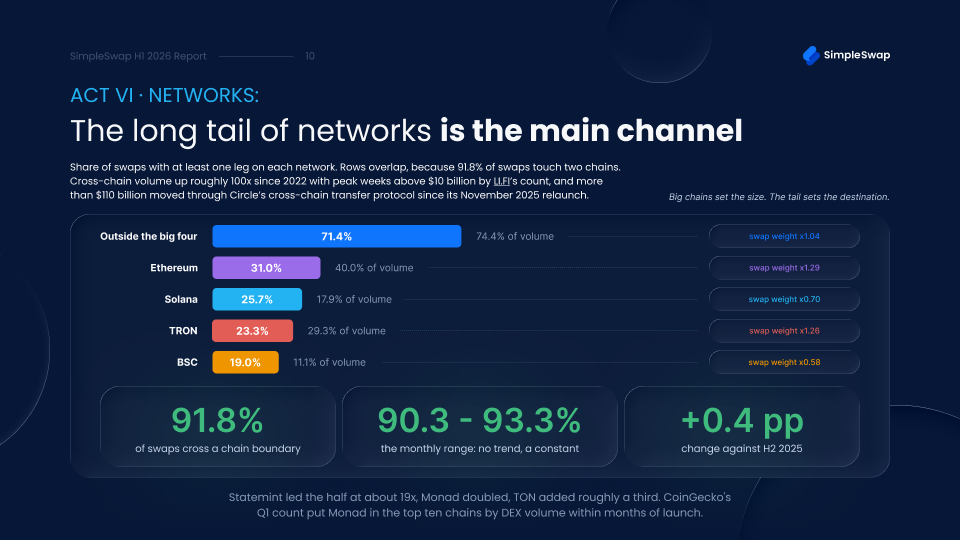
Cross-chain swaps accounted for 91.8% of activity, while 8.2% remained within a single network, a gain of 0.4 points from the previous half. That figure describes the product as much as the period. People come to an aggregator precisely to cross chains, so we read it as reach rather than as a market ratio.
The market is moving in the same direction. Cross-chain volume across the industry has grown by roughly a hundredfold since 2022, with peak weeks topping $10 billion by LI.FI’s count, and Circle’s cross-chain transfer protocol processed more than $110 billion in the months after its November 2025 relaunch. Interoperability is no longer a niche; it is now the default assumption for new infrastructure.
Month to month, the figure stayed within a narrow range of 90.3% to 93.3%, with lows in January and April and a peak in May. There was no trend in the second half, making this the most stable behavior in the report.
Because nearly every swap touches two networks, the shares below represent reach rather than a division of the whole. Each figure answers one question: what percentage of swaps had at least one leg on this network.
The first row is the finding. Seven swaps in ten had at least one leg beyond the four largest networks, which is twice the reach of Ethereum, the most popular single chain of the half.
The second layer concerns swap size. Ethereum and TRON carry more money than trades, while Solana and BSC do the reverse, and the spread between the extremes runs past two times. Networks outside the Big Four are neutral on this measure, with an average swap almost identical to that of the platform.
Statemint led the half for growth at nearly nineteen times. Monad followed with a doubling, and TON added roughly a third.
The benchmark agrees on the direction of travel: CoinGecko’s Q1 count showed Monad entering the top ten chains by DEX volume within months of launch—the same network that doubled on our platform.
Rubic’s own breakdown agrees on the biggest single mover. Comparing H2 2025 with H1 2026 across swaps that touch two chains, TRON rose from 4.2% to 9.4% of Rubic’s cross-chain transactions and from 11.9% to 38.4% of cross-chain volume, a jump that mirrors TRON’s place as the largest net gainer on our own platform this half. Solana also rose on both counts, and Ethereum moved in two directions: more transactions, less volume — evidence that size is shifting toward smaller chains even as Ethereum remains the most-touched network by count.
Where Rubic’s view diverges from ours is the long tail as a whole. Everything outside Rubic’s top four chains held its share of cross-chain transactions roughly flat but lost nearly half its cross-chain volume, and Rubic is explicit that this does not support a simple growth story for that group. The two platforms measure different universes—cross-chain-only traffic versus all traffic—so part of the gap comes from the comparison rather than the market. TRON’s rise is the finding that carries across both.
Near Intent adds a second check from an aggregator designed specifically to route swaps across chains. In more than 14 million swaps in H1 2026, the company says nearly 57% of users touched at least one network outside Ethereum, TRON, Solana, and BSC—below our own 71.4%, but still a majority. Near Intent has handled over $25 billion in all-time volume. It did not provide a direct comparison with H2 2025, so this figure should be read as a snapshot rather than a trend.
“What is apparent to us as a multi-chain wallet is how frequent cross-chain activity has become within the wallet. Users are following assets, opportunities and applications across ecosystems rather than staying on a single chain, and they want to be able to get there without friction.”
— Zerobit, CEO, Talisman Wallet
What does it mean? The long tail of networks turned out to be the main channel, not a tail. Large chains determine the size of a swap. Everything else determines where it can go. Aggregation lives precisely at that seam, since nine swaps in ten cross a network boundary and seven in ten have a leg beyond the popular rails.
What’s next
Three observations about behavior. None of them is a price forecast.
Fear burns out. Three drawdowns in a row produced a fading response, from a sixfold surge into safety down to nothing at all. If that is a property of the market rather than a coincidence, stablecoin flows work as a sentiment indicator only at the first event of a cycle; analysts reading them later in a cycle are reading a signal that has already been spent.
Coverage is insurance, not advertising. The median new asset waited about seven weeks for its first user, and the memecoin segment accounted for about 1% of our turnover even as meme trading stayed loud in the wider market. Neither fact argues for listing less. Both argue for treating catalog length as a cost of readiness rather than as a number to put on a landing page.
Moving beats swapping. Nine swaps in ten on this platform cross a network boundary, and market-wide, the same pattern shows up as record stablecoin settlement against a flat supply. Demand is shifting from changing what you hold to changing where you hold it. If that continues, the useful measure of an exchange venue becomes how many places it can reach rather than how many assets it lists.
The second half will test the first of these. Another drawdown of comparable depth would either confirm that the response continues to fade or indicate that it is resetting after a quiet stretch. We will report which one happened.
Media and analysts can request additional cuts of this data at marketing@simpleswap.io.
About SimpleSwap
SimpleSwap is a self-custodial multi-source swap aggregator. It draws liquidity from more than 20 CEX and DEX sources, covers 2,800+ assets, and handles provider and route selection under the hood. Over 8+ years, 10M+ users have swapped through SimpleSwap, and 6,000+ projects use it as a business solution, including Exodus and Tangem. SimpleSwap’s only official domain is simpleswap.io.
The information in this article is not a piece of financial advice or any other advice of any kind. The reader should be aware of the risks involved in trading cryptocurrencies and make their own informed decisions. SimpleSwap is not responsible for any losses incurred due to such risks. For details, please see our Terms of Service.