BTC On-chain Analysis Mid-November 2023
Key Insights
- The significant increase in Bitcoin transactions under $1 and above $10 million as indicated by on-chain analysis suggests growing retail interest and potential institutional involvement, representing a positive signal for Bitcoin price prediction.
- Analysis of increasing unspent Bitcoin outputs (UTXO) across multiple timeframes from less than 1 day to over 5 years as per on-chain data points to changing investor strategies and sustained participation, which when combined with rising address counts could support bullish Bitcoin prediction.
- Increases in balances across all categories including the largest holders points to expanded involvement from big institutions, providing confirmation for optimistic Bitcoin price predictions as advanced infrastructure attracts renewed attention from major market players.
Bitcoin on-chain data provides valuable insights into the cryptocurrency's adoption and usage.
By examining the transactions and activities occurring on the Bitcoin blockchain, traders can complement price chart analysis with a view of how BTC is actually being utilized. Recent trends point to growing diversity and interest in Bitcoin from both retail and institutional perspectives.
What is On-chain Analysis
On-chain analysis involves the study of transactions and activities occurring on a blockchain network. It utilizes publicly available on-chain data recorded on a blockchain to obtain valuable information about the state of a cryptocurrency or token.
For Bitcoin, on-chain analysis gives understanding into the overall network and crypto market by analyzing the on-chain data.
Unlike price chart analysis which examines Bitcoin's historical pricing, on-chain analysis looks at the actual BTC transactions taking place on the blockchain. This provides insights into how Bitcoin is being used in practice as peer-to-peer electronic cash.
Some key aspects analyzed in Bitcoin on-chain analysis include:
- Bitcoin Transactions
The number of daily/weekly BTC transactions indicates network activity and adoption levels.
- Active Addresses
The number of unique Bitcoin addresses active on the network reflects user adoption.
- Transaction Value
The aggregated USD value of BTC transactions represents economic throughput.
- Exchange Flows
Analyzing Bitcoin inflows and outflows to/from exchanges provides supply dynamics.
- Hash Rate
The overall computing power securing the BTC network measures security and resilience.
- Miner Revenue
Total mining revenue from block rewards/fees helps assess network security incentives.
- Unspent Transaction Output (UTXO)
The UTXO set represents Bitcoin available for transactions, indicating potential economic activity.
Thus, Bitcoin on-chain analysis is a useful tool. It allows traders to better understand the BTC market and make decisions based on sound Bitcoin technical analysis.
Number of Bitcoin Transactions
The number of transactions in the network increased on the background of the growth of the BTC asset value, from a low of October 242.44k to 703.33k.
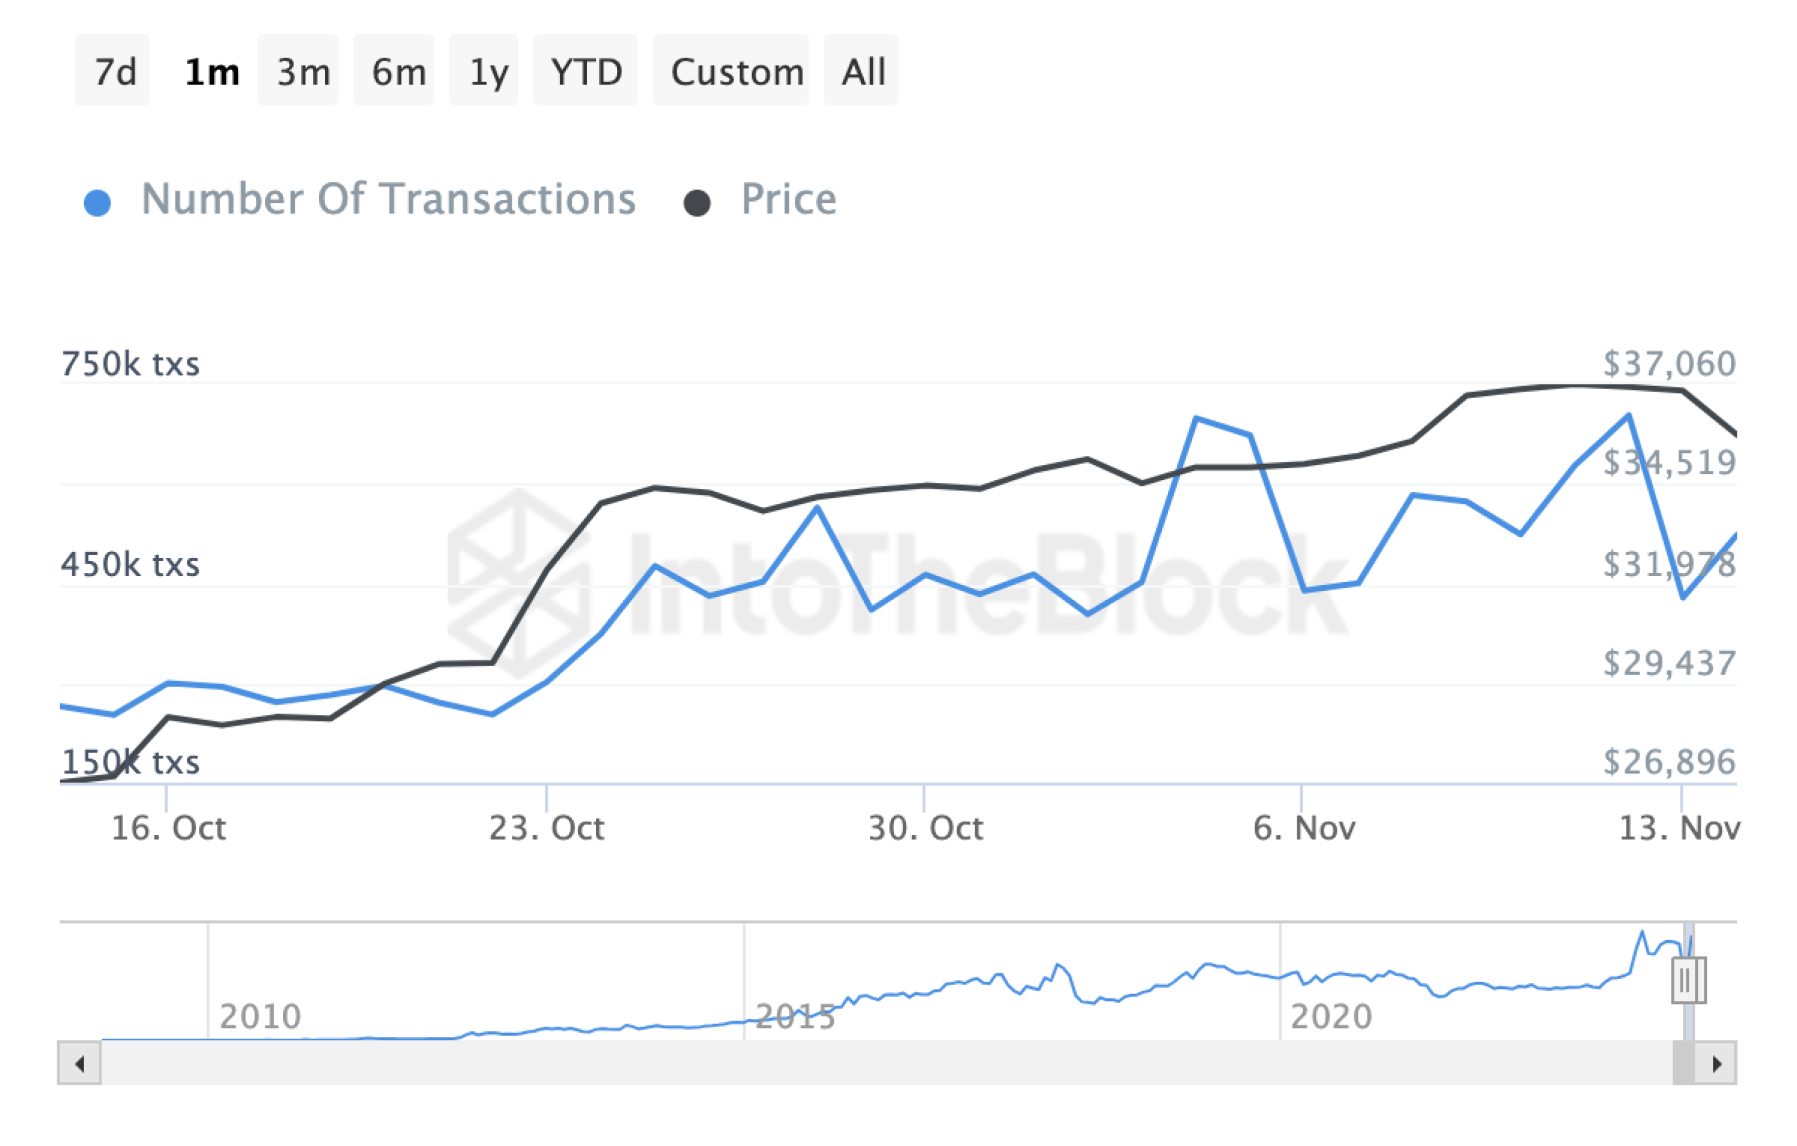
The growth in the number of Bitcoin transactions may indicate higher user activity in the Bitcoin network. This may be due to the increased interest in the cryptocurrency as a result of a 40% rise in the price of BTC and interpreted as a positive signal for investors and market participants.
BTC Transaction Volume in USD by Size
There was an increase in the volume of Bitcoin transactions of size:
Up to $1 by 771.59%
> $10m by 46.41%
These changes in transaction volumes indicate a diversity of activity in the BTC to USD market. The increase in small transactions can be interpreted as an increase in interest from individual users or minor investors.
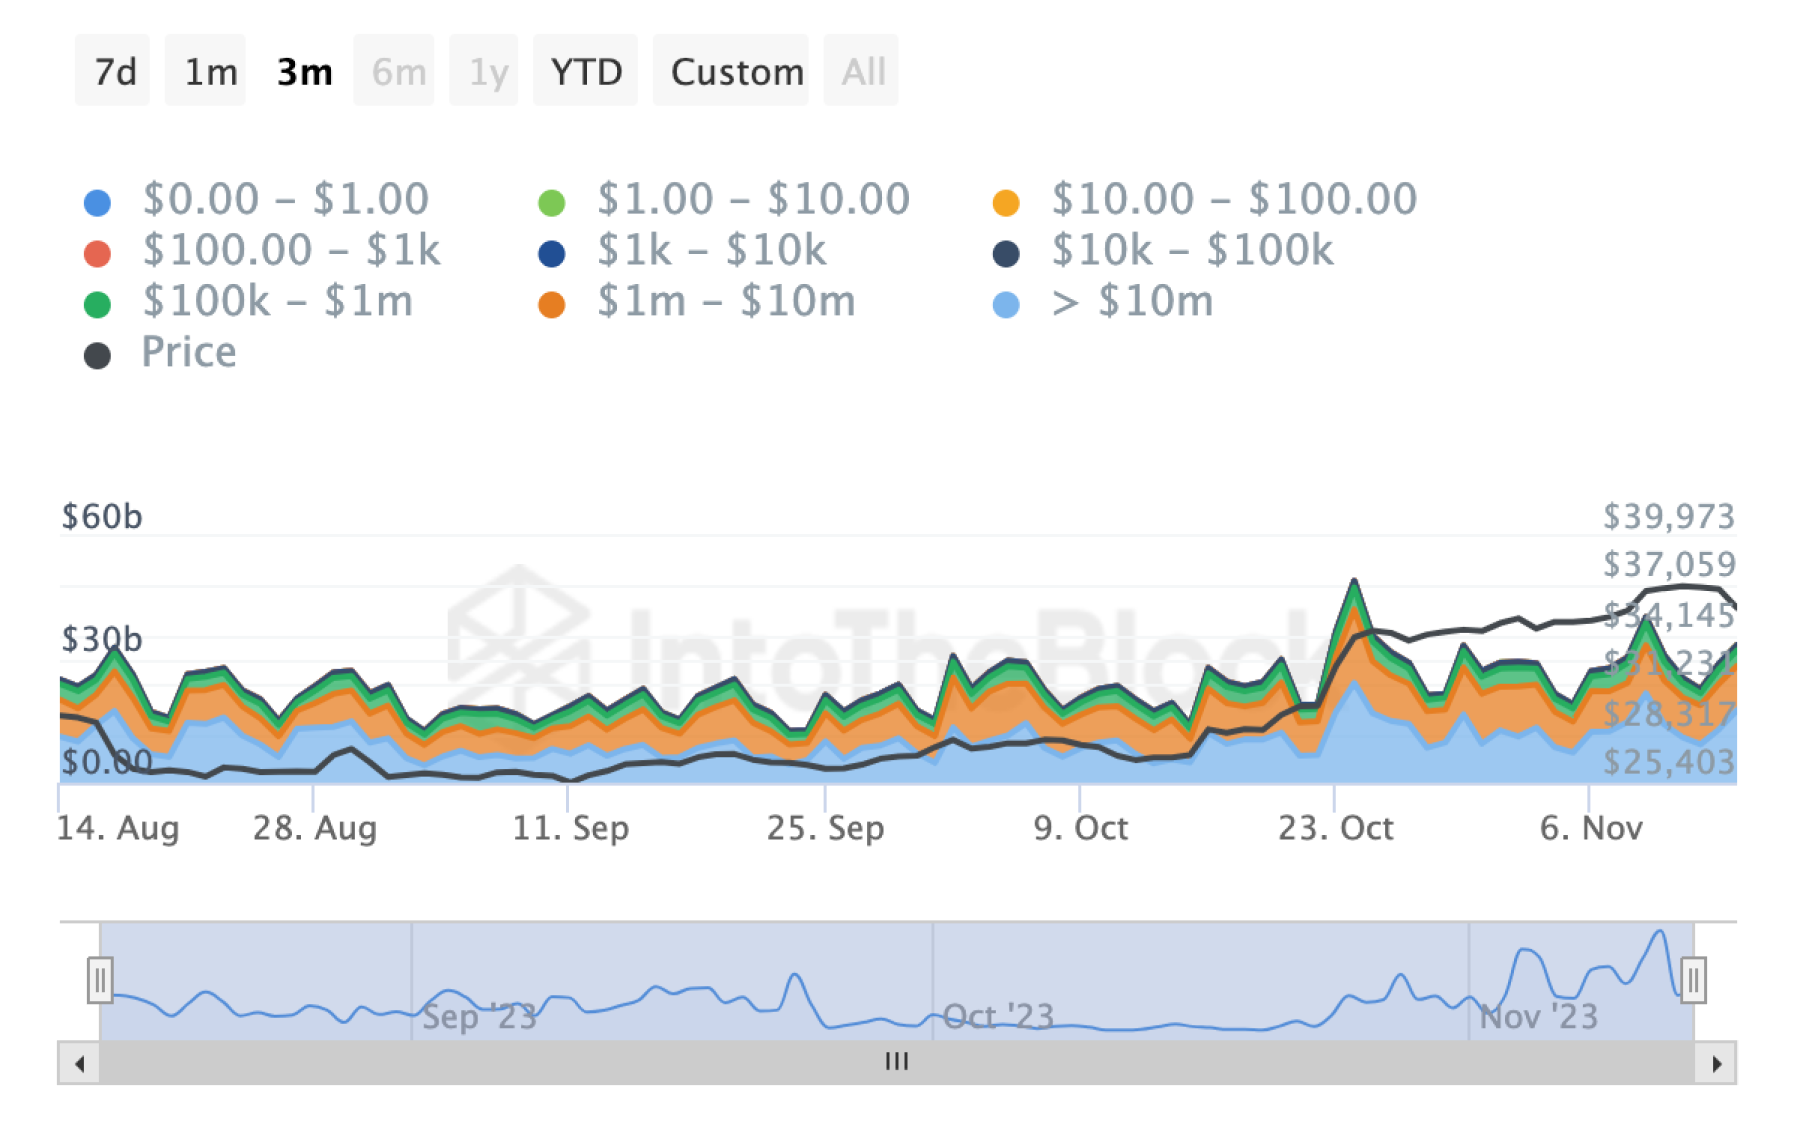
At the same time, an increase in large transactions may indicate increased interest from large players or institutions. The increased transaction volume could lead to a potential increase in the Bitcoin to USD price if the increased activity continues.
Number of Total BTC Addresses
The increase in the number of Bitcoin addresses from 48.31m to 49.16m was 1.75%.
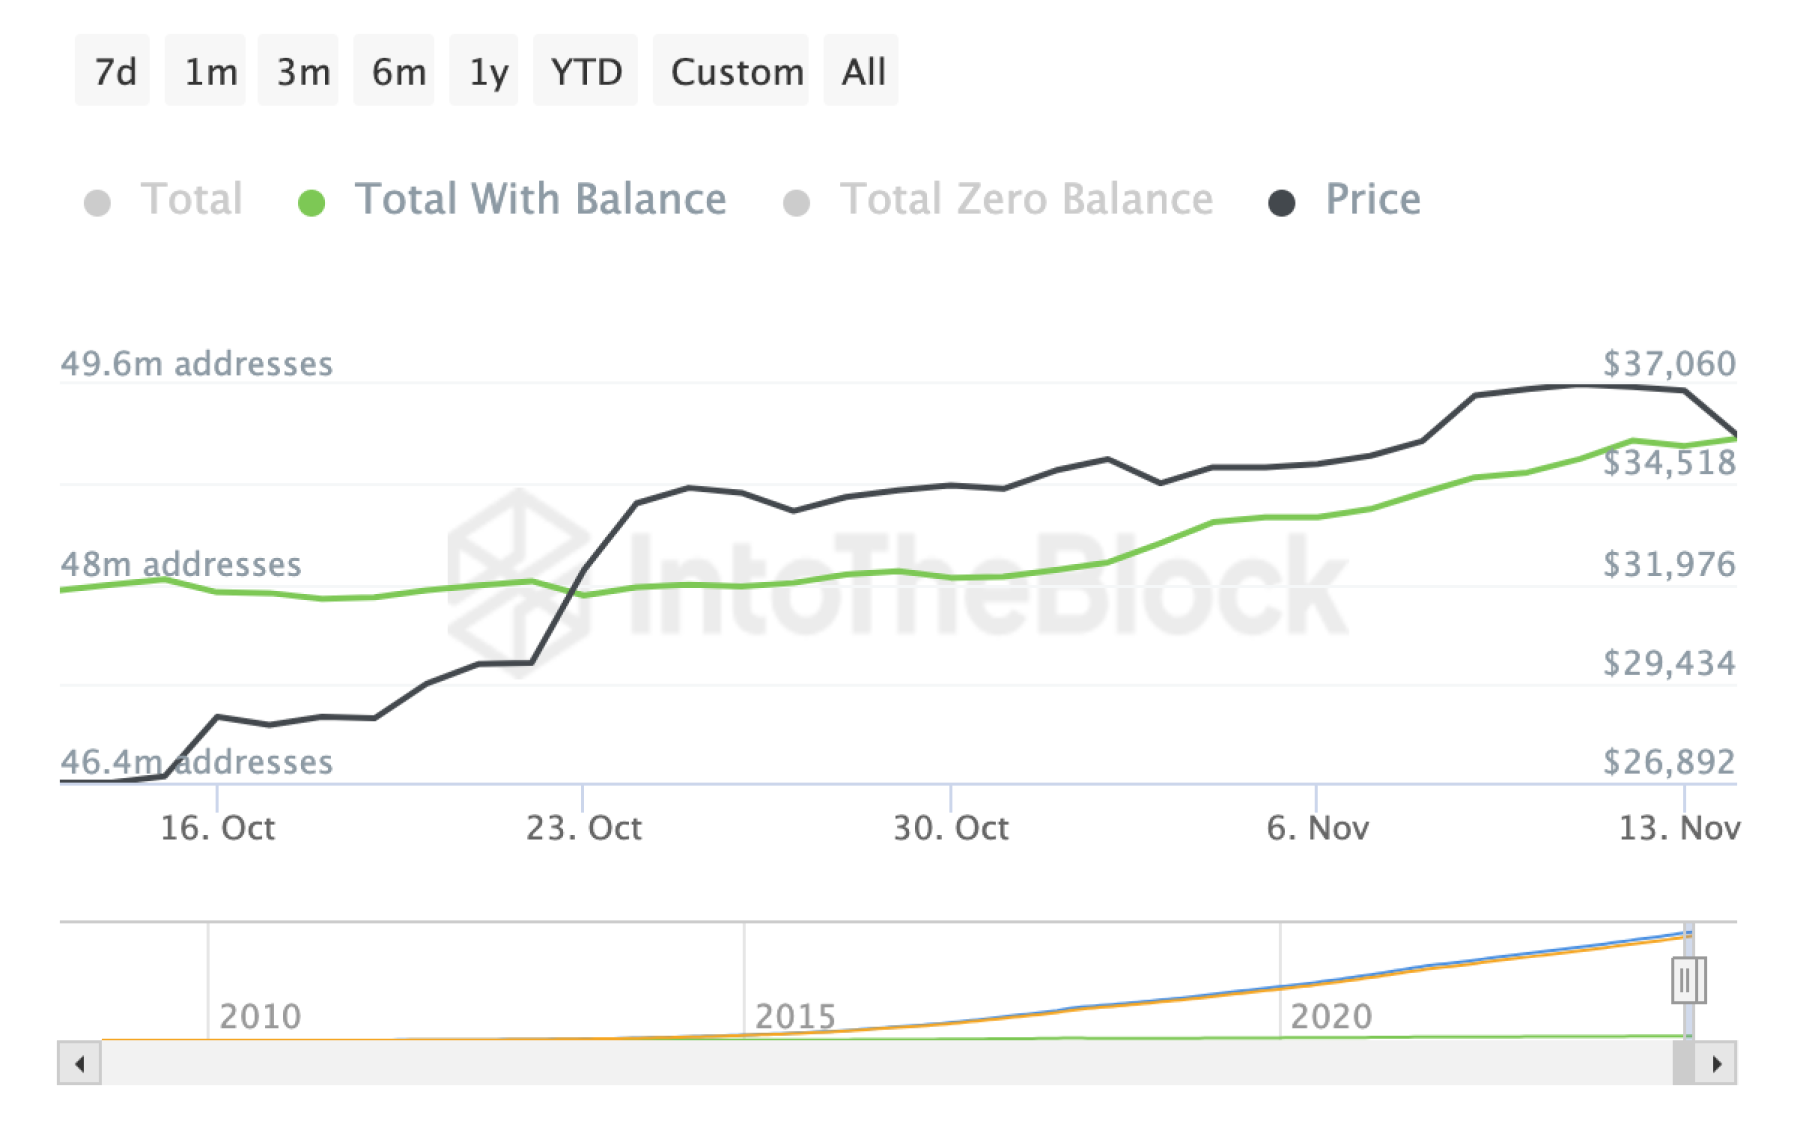
The rise in the number of addresses may indicate new participants joining the Bitcoin network, as well as general activity on the network.
BTC Balance by Holdings
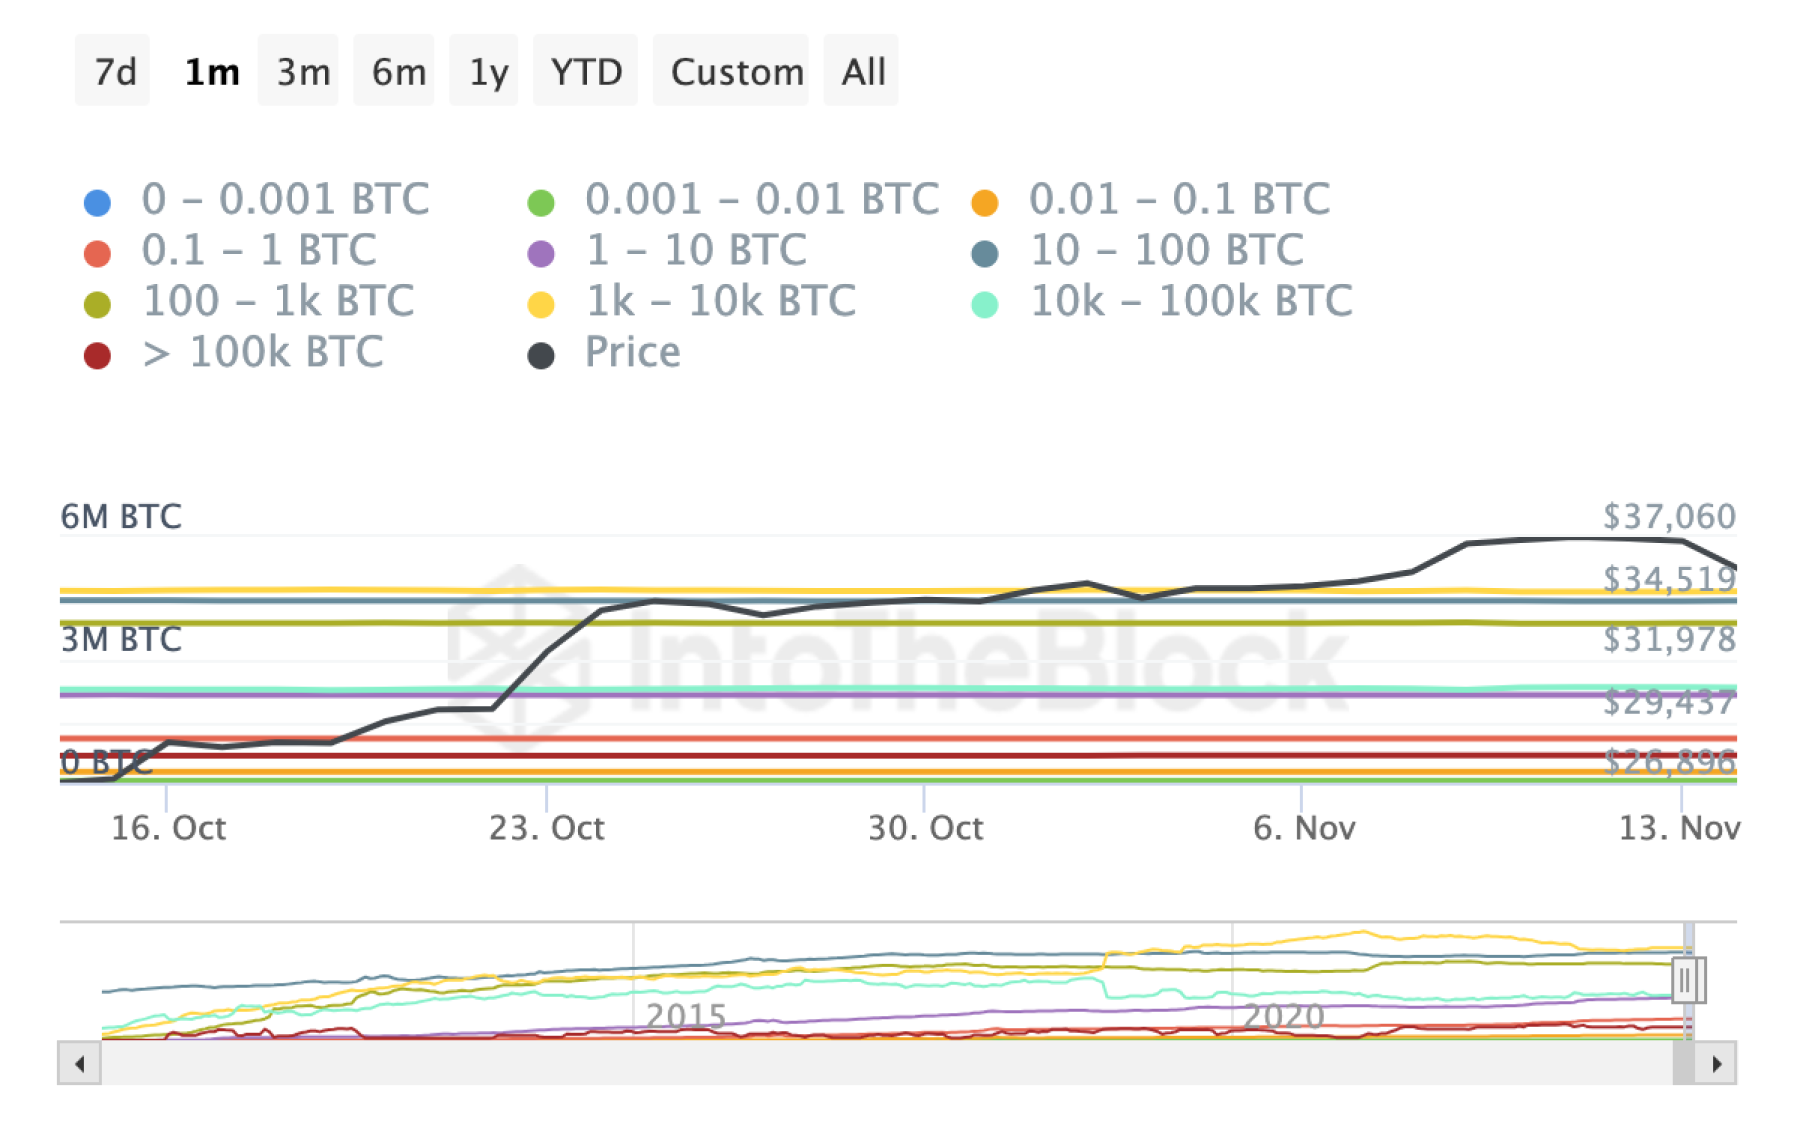
There is a slight increase in the balance of BTC holders.
- Increased interest of small holders (0 - 0.001 BTC): +4.44%
The increase in balance in this category may reflect the growing interest of new investors and network members with small investments in Bitcoin transactions.
- Increase in the share of medium-sized holders (0.001 - 0.01 BTC): +3.05%
The growth of BTC balances in this range indicates increasing interest from investors with low and relatively medium-sized investments.
- Increase in the percentage of large holders (10k - 100k BTC): +2.01%
An increase in the percentage in this category may indicate greater participation by large institutional holders and increased activity in Bitcoin transactions by these holders.
- Increase in the percentage of the largest holders (> 100k BTC): +1.82%
An uplift in percentage in this category may indicate increased interest or activity by the largest market participants, such as large exchanges or institutional investors, relating to movements in the Bitcoin price.
Bitcoin Analysis: UTXO Age Analysis
The Unspent Transaction Outputs Age (UTXO Age) metric provides information about the time that has passed since the last transaction for unallocated (unspent) transaction outputs on the Bitcoin network.
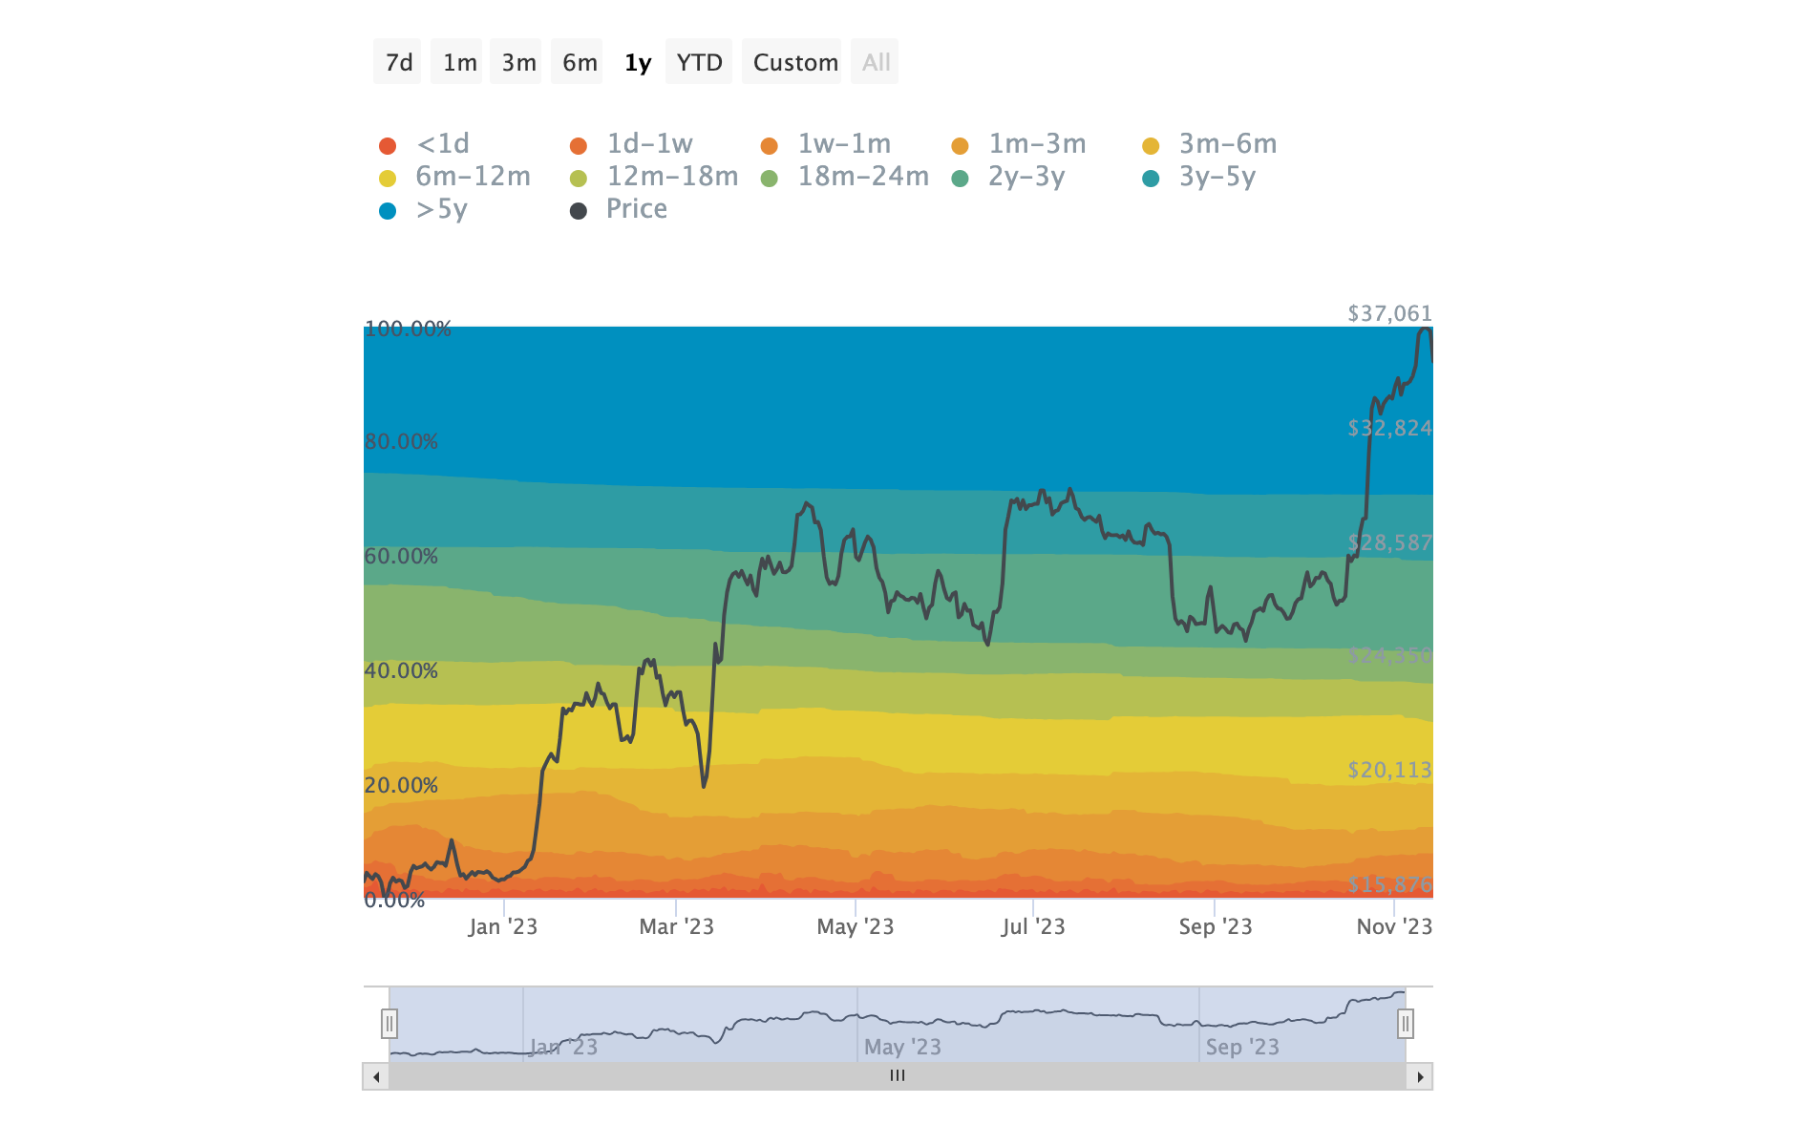
Let's break down each time interval.
- <1d (less than 1 day): +32.33%
The positive percentage (+32.33%) indicates that there was a significant increase in BTC transaction activity on the last day, which can be attributed to heavy trading.
Analyzing Bitcoin price today and recent transactions can provide insight into the reasons for this surge in activity.
- 1d-1w (1 day - 1 week): -1.97%
A negative percentage (-1.97%) indicates a decrease in activity in this time frame. This may be the effect of changing crypto market conditions that have resulted in restrained activity in this interval.
BTC analysis for this period can show which forces are active in the market.
- 1w-1m (1 week - 1 month): +0.86%
The upward trend (+0.86%) indicates an increase in activity in this longer period. It might be so because of the growing popularity of BTC and rising Bitcoin price.
- 1m-3m (1 month - 3 months): +4.56%
Positive interest (+4.56%) indicates a marked increase in activity over the relatively longer term. This could be due to changes in investor strategies or heightened interest in the asset as the Bitcoin price continues its ascent.
- 3m-6m (3 months-6 months): -4.24%
A negative percentage (-4.24%) indicates a decline in activity over a relatively short period, which might be aconsequence of funds being held back in anticipation of future Bitcoin price movements.
- 6m-12m (6 months-12 months): -7.63%
A negative percentage (-7.63%) indicates a decrease in activity over the long term because of retention periods.
- 12m-18m (12 months - 18 months): +8.88%
A positive percentage (+8.88%) indicates an increase in activity over the relatively medium term. This could be the result of changes in investment strategies. Investors may have changed their strategies with respect to their portfolio management.
For example, they may have decided to react more actively to changes in market conditions and fluctuations in Bitcoin price, increase the proportion of BTC in the portfolio, rebalance their portfolio or realize a portion of gains.
- 18m-24m (18 months - 24 months): +1.46%
Transactions made between 18 months and 24 months are considered here. As in the yearly term, there is a positive percentage (+1.46%), indicating an activity rise as a result of changes in holders' strategies.
Investors may have changed their strategies with respect to portfolio management. Investors may have chosen to respond more actively to movements in the market according to Bitcoin analysis and adjust the percentage of BTC, recalibrated their portfolio allocation, or cashed in some profits.
- 3y-5y (3 years to 5 years): +0.27%
The positive percentage (+0.27%) indicates an increase in activity in the relatively long term. This can be attributed to the increasing interest in BTC driven by its rise in Bitcoin price.
- >5y (more than 5 years): +0.14%
The positive percentage (+0.14%) indicates an increase in activity in the longest term holdings. This could be due to wallet replenishment or the addition of new funds allocated towards long term reserves.
Investment Perspective of Bitcoin
BTC technical analysis and on-chain analysis provide insights into investor behavior and strategies. The general trend of on-chain data in the Bitcoin network speaks about the attractiveness of the asset.
Investors can see in these dynamics confirmation of the growing interest in Bitcoin as a means of capital preservation and an investment tool.
The diversity of crypto market participants, active participation of both small and large investors, and strategic changes in asset retention form the overall picture of a favorable investment environment for Bitcoin.
Users can get BTC for fiat or crypto on SimpleSwap.
Summary
On-chain analysis of Bitcoin indicates a significant rise in transactions under $1 and above $10 million, suggesting increased interest from both retail and institutional investors. This is a positive sign for Bitcoin price predictions, reflecting growing adoption and usage.
The on-chain analysis also reveals an increase in unspent transaction output (UTXO) across various timeframes, indicating evolving investor strategies and sustained engagement. This, along with rising address counts, supports a bullish outlook for Bitcoin.
Examining the balances across different holder categories, including the largest holders, shows expanded involvement from major institutions. This signals optimism as advanced infrastructure attracts significant attention from key crypto market players.
The increased activity from both small and large holders, along with rising transaction volumes, underscores the growing diversity and interest in Bitcoin from various investor demographics. These trends collectively enhance the positive sentiment towards future Bitcoin price.
Bitcoin’s on-chain data offers valuable insights into its adoption and market dynamics. By analyzing transactions and blockchain activities, traders gain a comprehensive understanding of Bitcoin’s practical use and market health.
The increasing diversity in transactions, address counts, and balances across holder categories points to a robust and growing interest in Bitcoin, indicating a favorable investment environment and promising price predictions.
The information in this article is not a piece of financial advice or any other advice of any kind. The reader should be aware of the risks involved in trading cryptocurrencies and make their own informed decisions. SimpleSwap is not responsible for any losses incurred due to such risks. For details, please see our Terms of Service.


