BTC and S&P500 Indexes Decorrelation

Key Insights
- By examining correlation charts, we can gain a data-driven understanding of how cryptocurrencies like Bitcoin perform relative to traditional stocks.
- The phenomenon of decorrelation between S&P Index and Bitcoin Index presents interesting opportunities for crypto investors.
- A look into how changes in BTC price are intertwined with prices of other cryptocurrencies (here: RNDR, XRP, LINK) and platforms' activity (here: Polygon)
Bitcoin Index and S&P 500 Index Correlation Overview
Analysis of the correlations between major crypto market indexes and traditional stock market indexes offers valuable insights.
Bitcoin has evolved far beyond being just an experimental or alternative investment tool, it has become an integral part of the global financial landscape. Its resilience and influence on global financial markets are undeniable.
In April 2023, we explored the correlation between BTC and the S&P 500, considering factors such as the rising interest in cryptocurrencies, the increasing interaction of crypto with the technology sector, and broader economic factors like inflation and market volatility.
On the other hand, in this article we will look into the decorrelation between Bitcoin index and S&P 500 index and what it might mean.
It is important to note that the correlation between Bitcoin and the S&P 500 might not be causal, it could be coincidental. However, investors should not overlook these possible correlation and decorrelation.
Understanding how the S&P 500 index might affect Bitcoin price is crucial for crypto market investors.
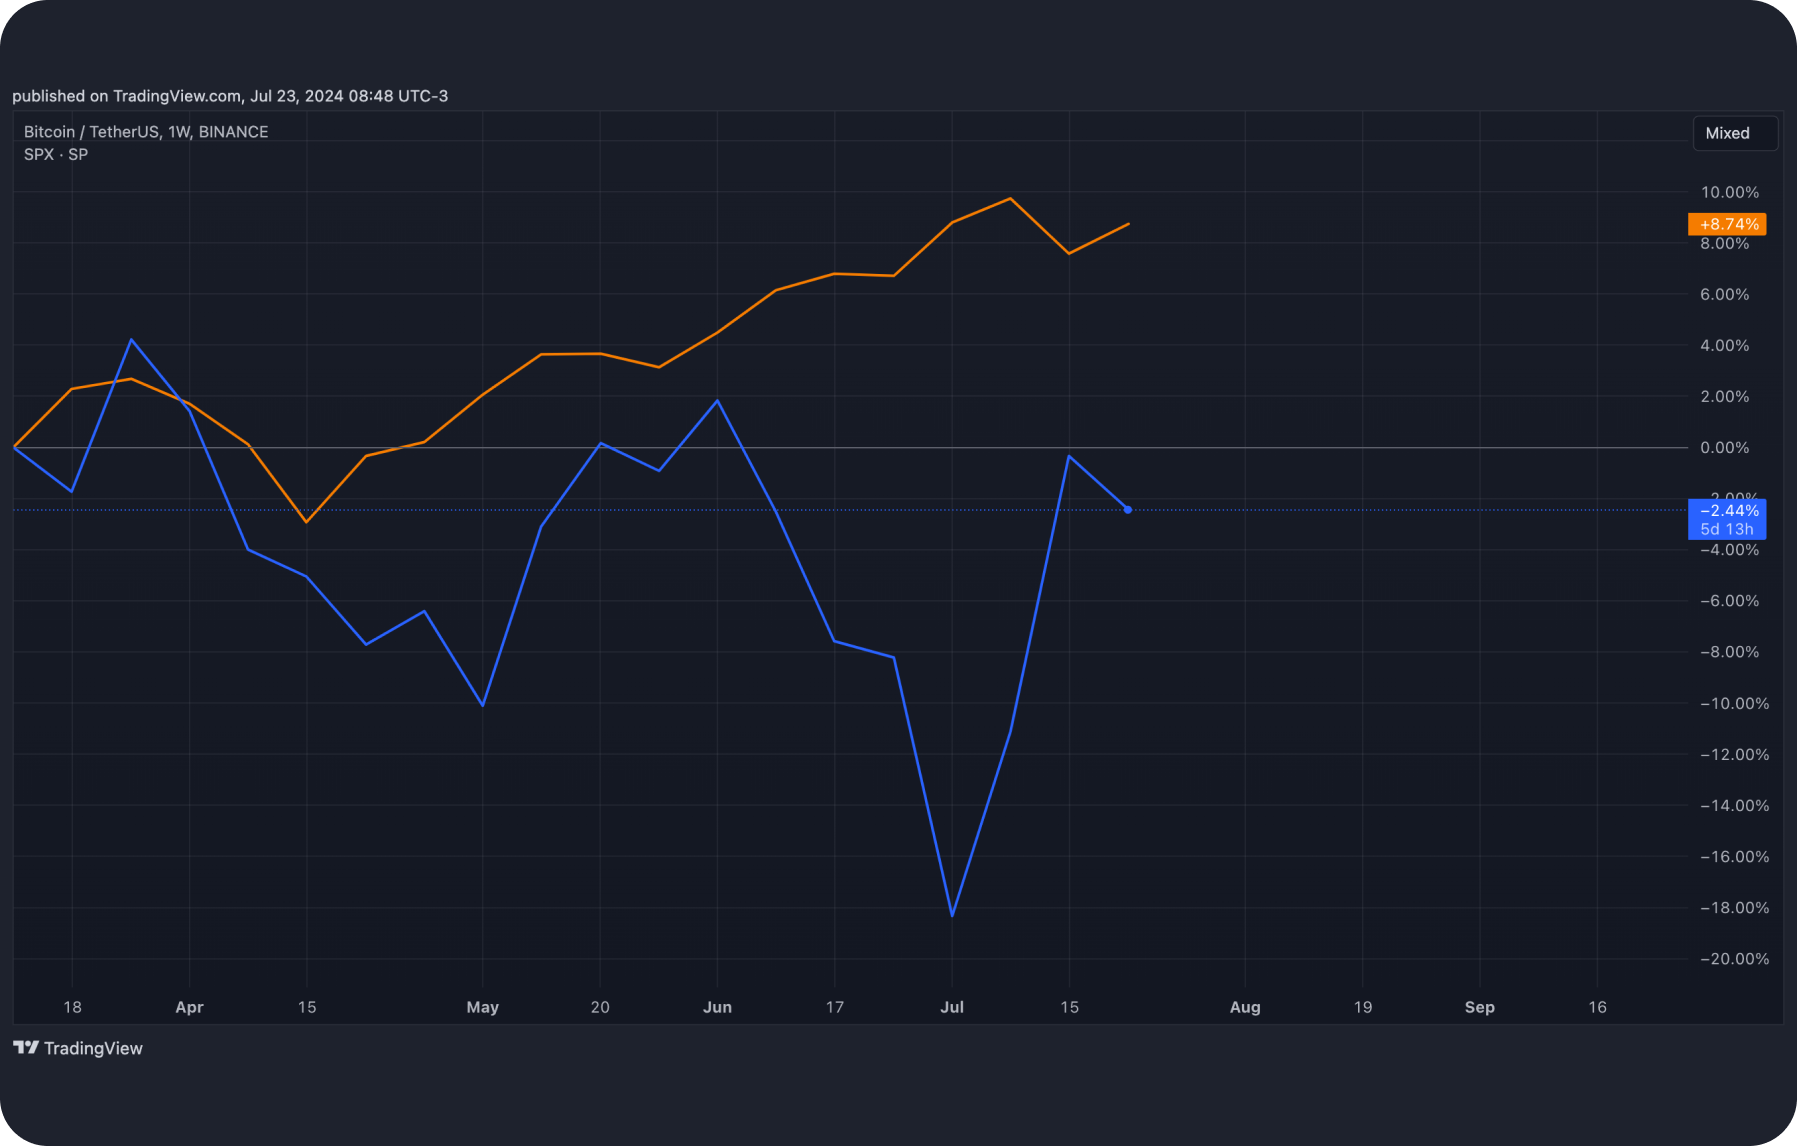
BTC and S&P500 Decorrelation
Current Market Dynamics
The S&P 500 Index has shown strong growth recently, reaching and updating all-time highs. This growth reflects high investor confidence in traditional stocks and support from institutional investors such as hedge funds and pension funds.
At the same time, the price of Bitcoin is declining, dragging down the entire cryptocurrency market.
Undervaluation of Bitcoin
Current Situation: The decline in the Bitcoin price amidst the rise of the S&P 500 may be a temporary phenomenoncaused by various macroeconomic technical and regulatory factors. Despite the current challenges, the long-term outlook for BTC remains positive.
Attractive Pricing: Falling price of Bitcoin could create unique opportunities for investors looking for assets with high upside potential. Bitcoin's current undervaluation makes it an attractive long-term investment.
Below is a layout of the behavior of several cryptocurrencies and crypto platforms that showcase the existing decorrelation between BTC index and S&P500 index.
Bitcoin Index and S&P500 Index Decorrelation: RNDR
A decline in the value of Bitcoin often leads to a drop in the prices of other cryptocurrencies, including RNDR, as BTC serves as an indicator for the entire cryptocurrency market. This can cause panic among investors and drive down the value of tokens.
RNDR Daily Active Addresses
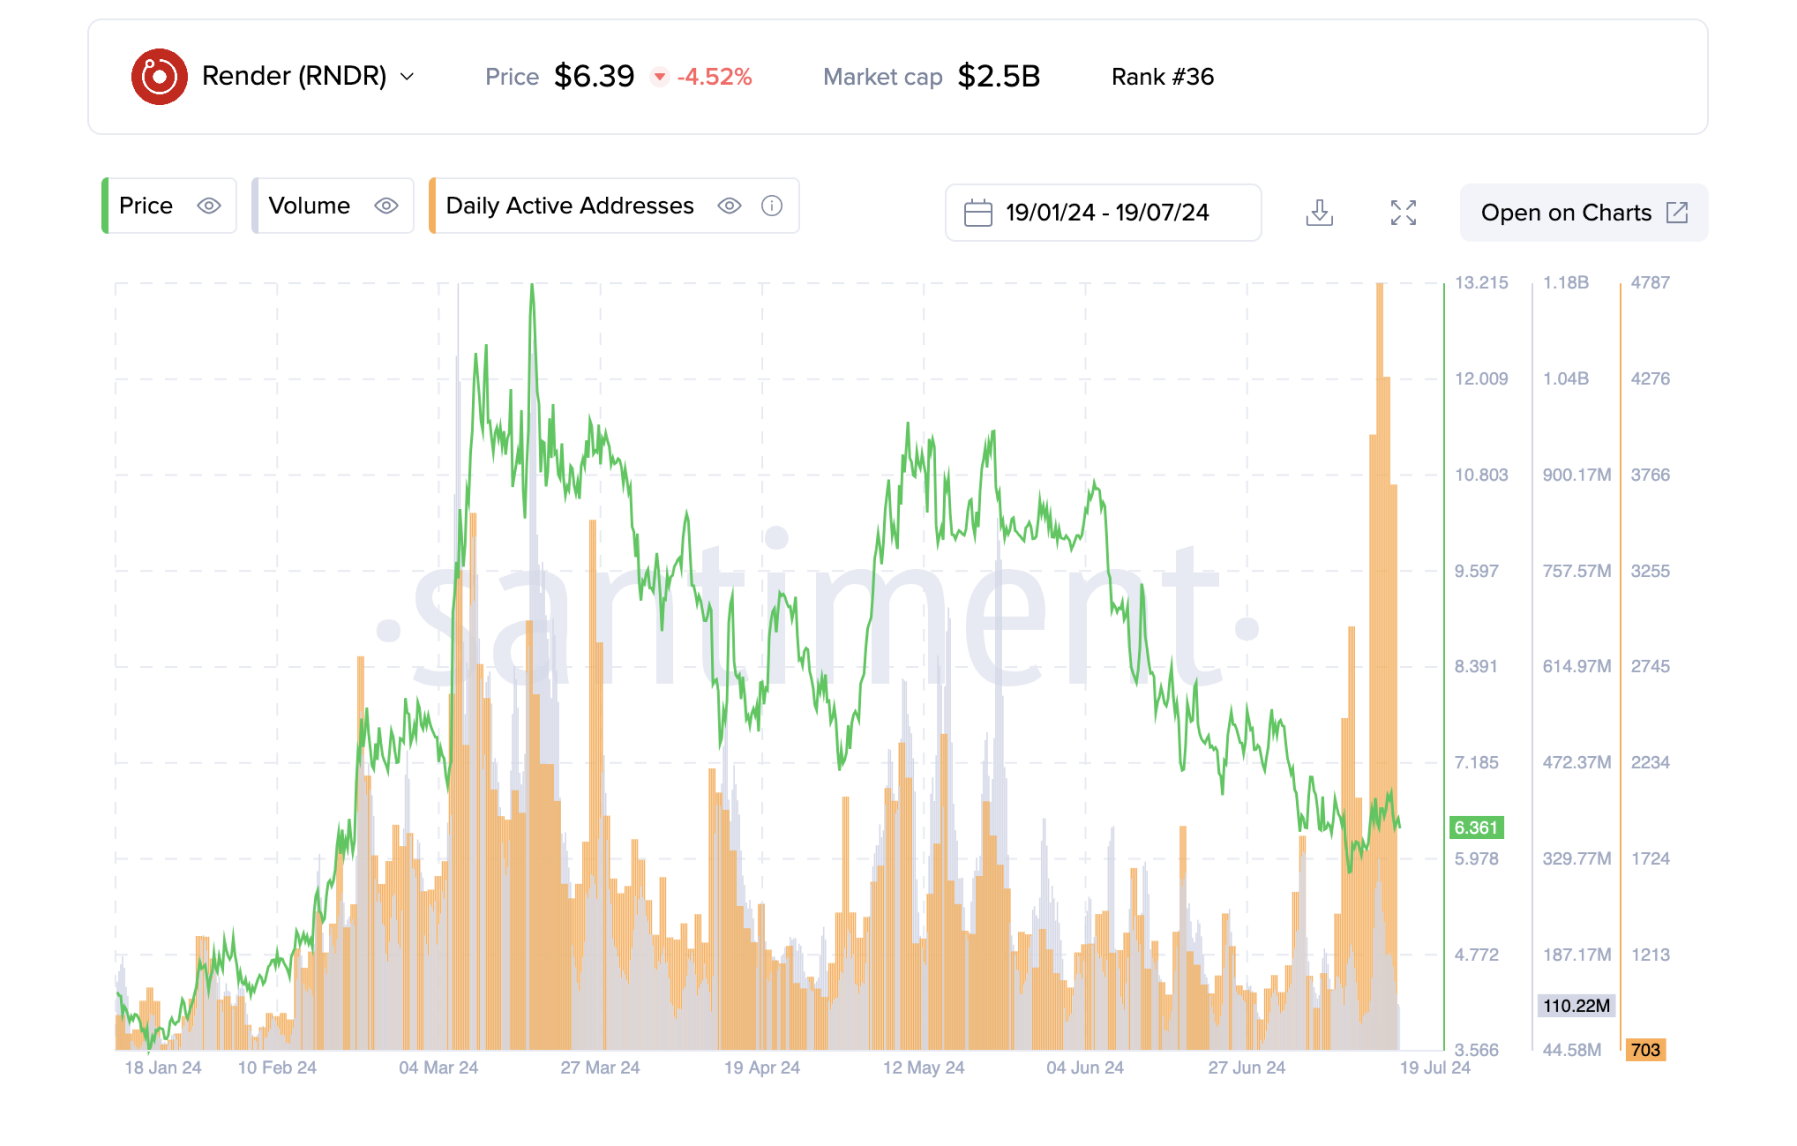
However, despite the general downward trend, RNDR is showing an abnormal increase in the number of active addresses. This may be due to market participants purchasing tokens at low prices in anticipation of growth, which increases activity.
Bitcoin Index and S&P500 Index Decorrelation: XRP
Similarly, the number of active addresses for XRP also increased.
XRP Daily Active Addresses
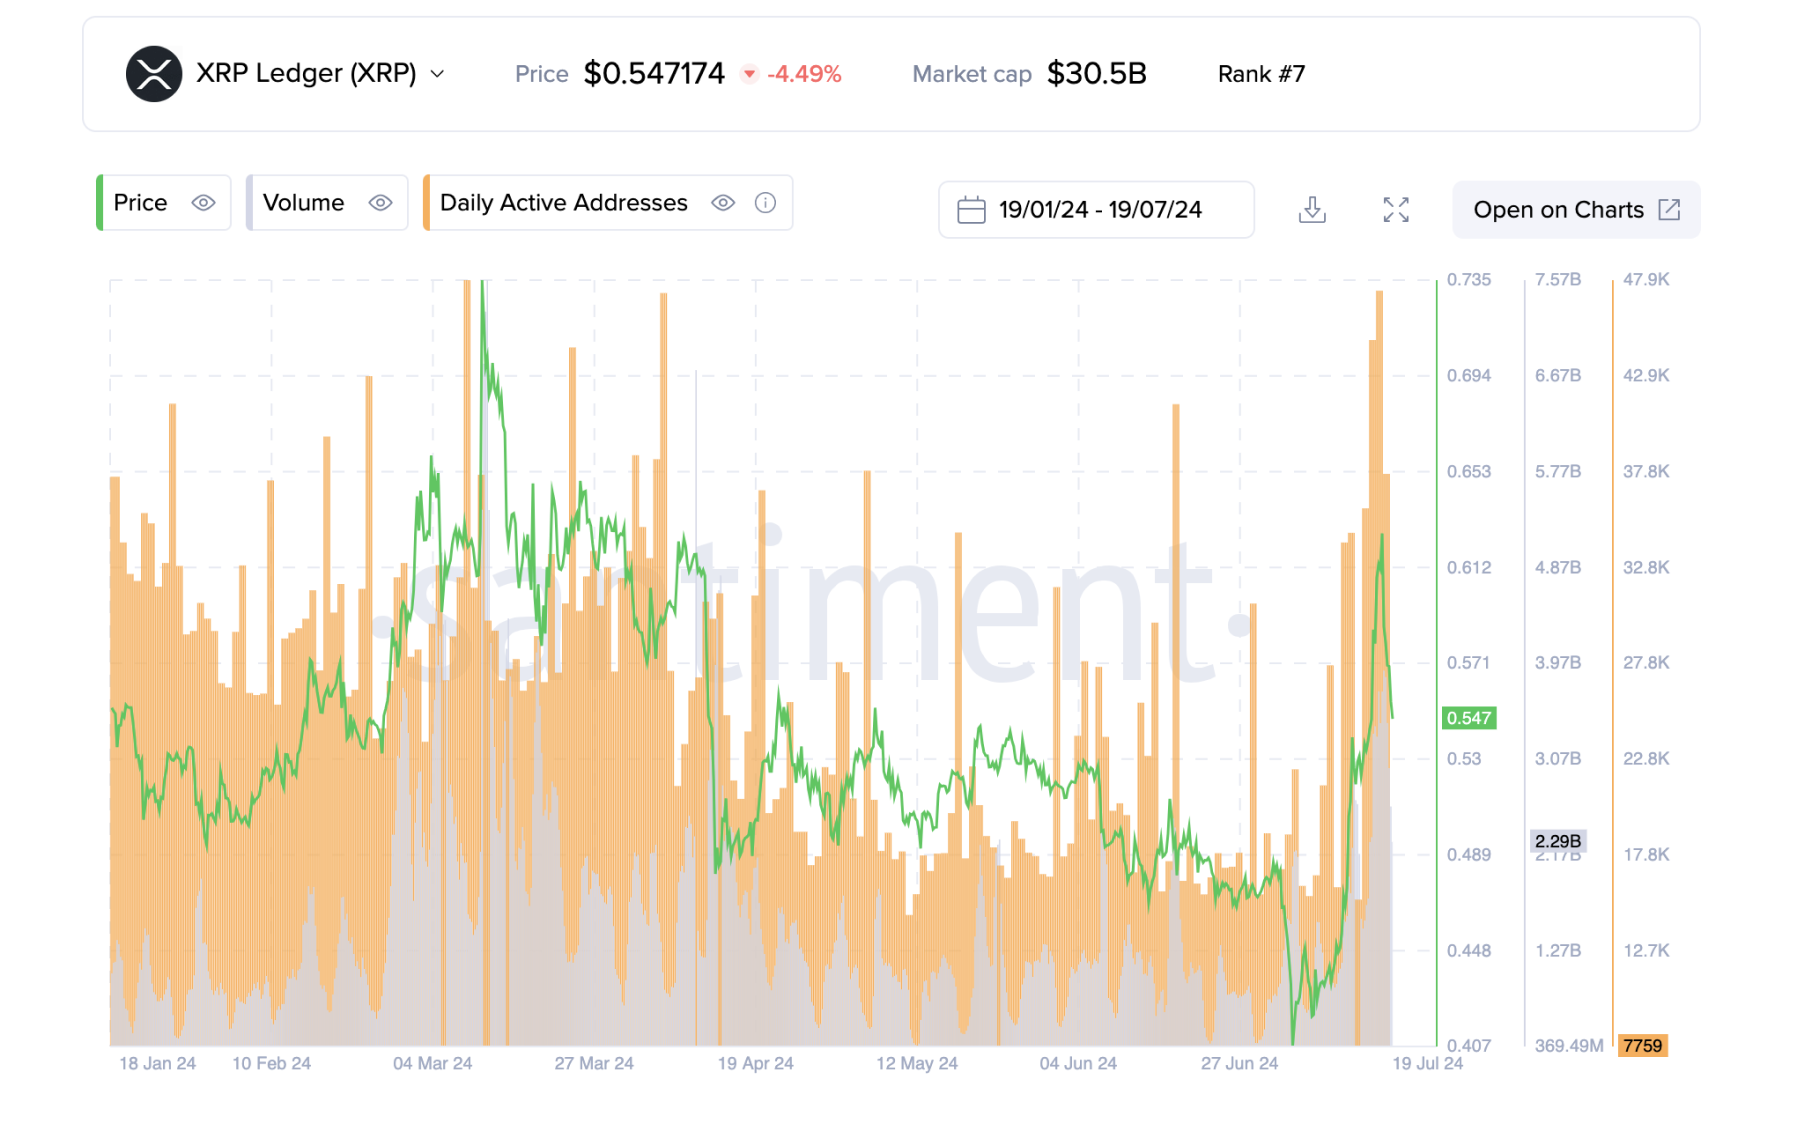
Despite the decrease in the value of XRP, activity on the network has increased. This may indicate that investors are purchasing tokens at reduced prices, which leads to an increase in the number of active addresses.
Bitcoin Index and S&P500 Index Decorrelation: Link on Polygon
The Chainlink (LINK) asset on the Polygon network is seeing an increase in activity despite a decrease in value.
LINK Daily Active Addresses
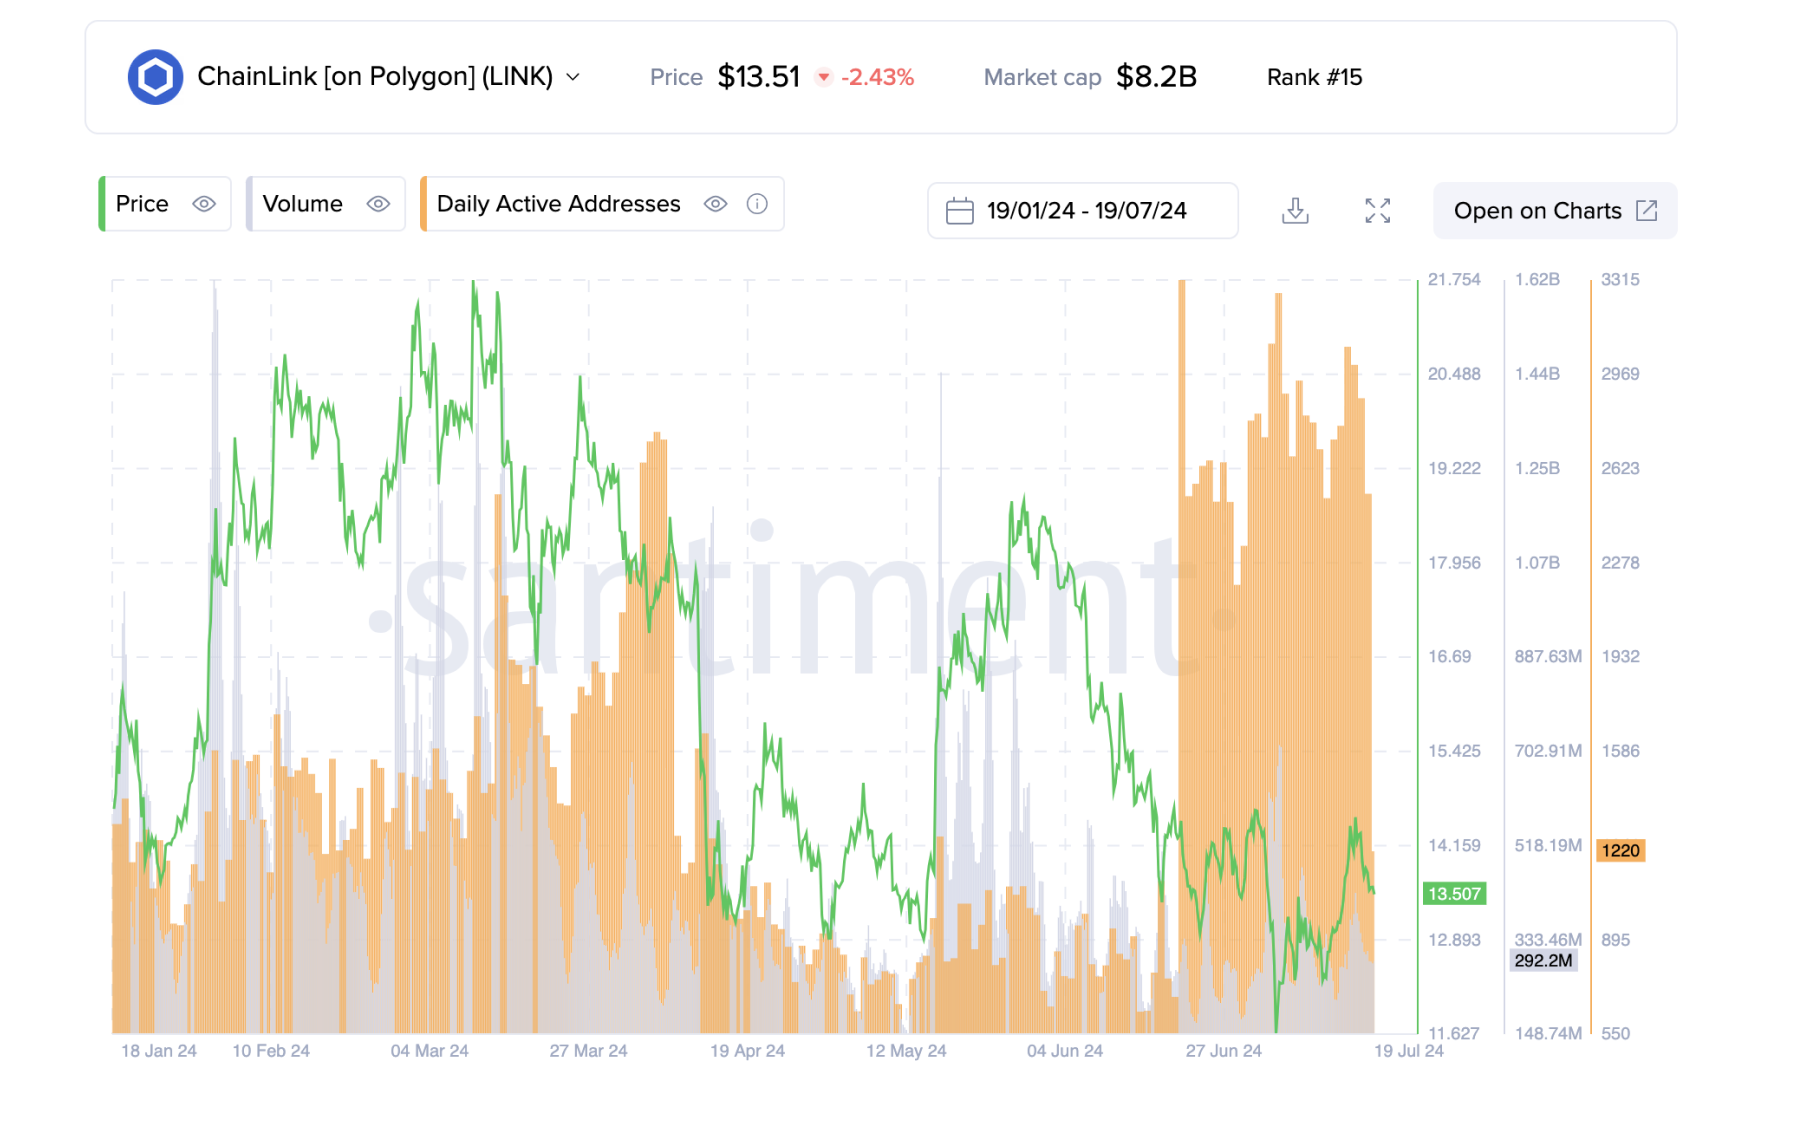
Users can more actively utilize Chainlink on Polygon to obtain pricing data, event information, and other external data needed for smart contracts. Investors may use the price decline as an opportunity to buy LINK at lower levels, which could lead to more active addresses and increased activity on the network.
Bitcoin Index and S&P500 Index Decorrelation: Polygon
The Polygon network also shows an abnormal increase in activity on the back of lower prices.
Polygon Daily Active Addresses
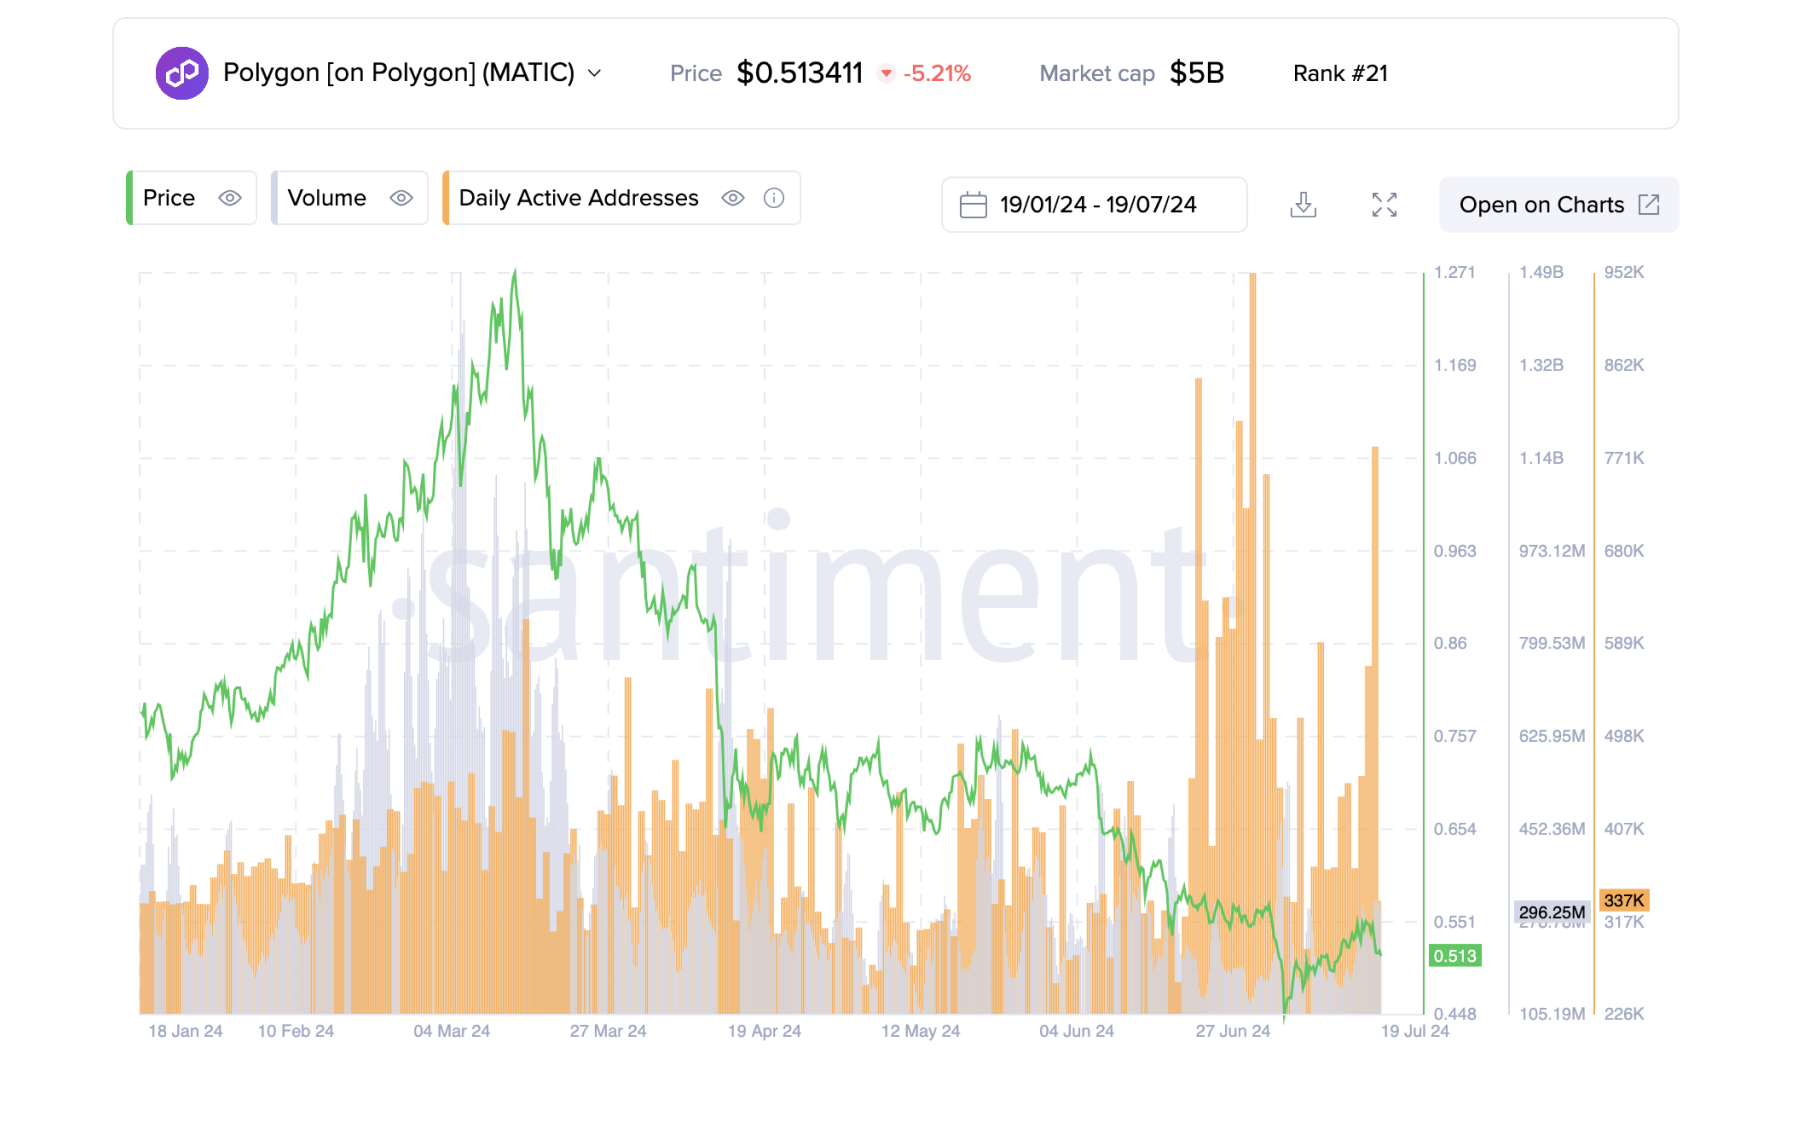
Users may use the Polygon network more actively for transactions and interaction with decentralized applications, especially if price reductions have led to more favorable conditions for transactions on the platform.
Decreasing Polygon token values may encourage traders and investors to purchase tokens at lower levels, which increases activity on the network.
Users can get all currencies mentioned in this article on SimpleSwap.
Summary
In this article we provided a deep look into the decorrelation between Bitcoin index and S&P 500 index.
The sustained rise in the S&P 500 against the backdrop of declining price of Bitcoin highlights the difference in perception between traditional and cryptocurrency assets.
For instance, a decline in the S&P500 index could potentially lead to increased demand for Bitcoin as investors seek alternative assets.
While Bitcoin price is showing a temporary decline, the long-term outlook remains positive, offering potential opportunities for investors focused on long-term growth.
The decline in the BTC price has also impacted other cryptocurrencies such as RNDR, XRP, LINK but there has been an increase in the number of active addresses, indicating a growing interest in these assets.
In particular, activity on the Polygon platform and among Chainlink users has also increased, indicating opportunities to invest and interact at lower price levels.
Thus, despite the current challenges and volatility, lower prices can be seen as an opportunity for strategic investments in cryptocurrency assets with high growth potential.
The information in this article is not a piece of financial advice or any other advice of any kind. The reader should be aware of the risks involved in trading cryptocurrencies and make their own informed decisions. SimpleSwap is not responsible for any losses incurred due to such risks. For details, please see our Terms of Service.


