SHIB Technical Analysis
Key Insights
- SHIB price has surged over 100% in 2023, breaking a downtrend and hitting a recent high before the correction of 38%.
- SHIB found the support level at $0.00000684 based on the volume profile analysis.
- The current POC marks the maximum support level where a rebound can occur if SHIB corrects further.
As of writing, SHIB holds the 14th position in CoinMarketCap's rankings, with a market cap of $6,572,288,709. Users can get SHIB for fiat or crypto on SimpleSwap.
SHIB Daily Timeframe
The price of the SHIB coin has shown an increase of more than 100% since the beginning of the year.
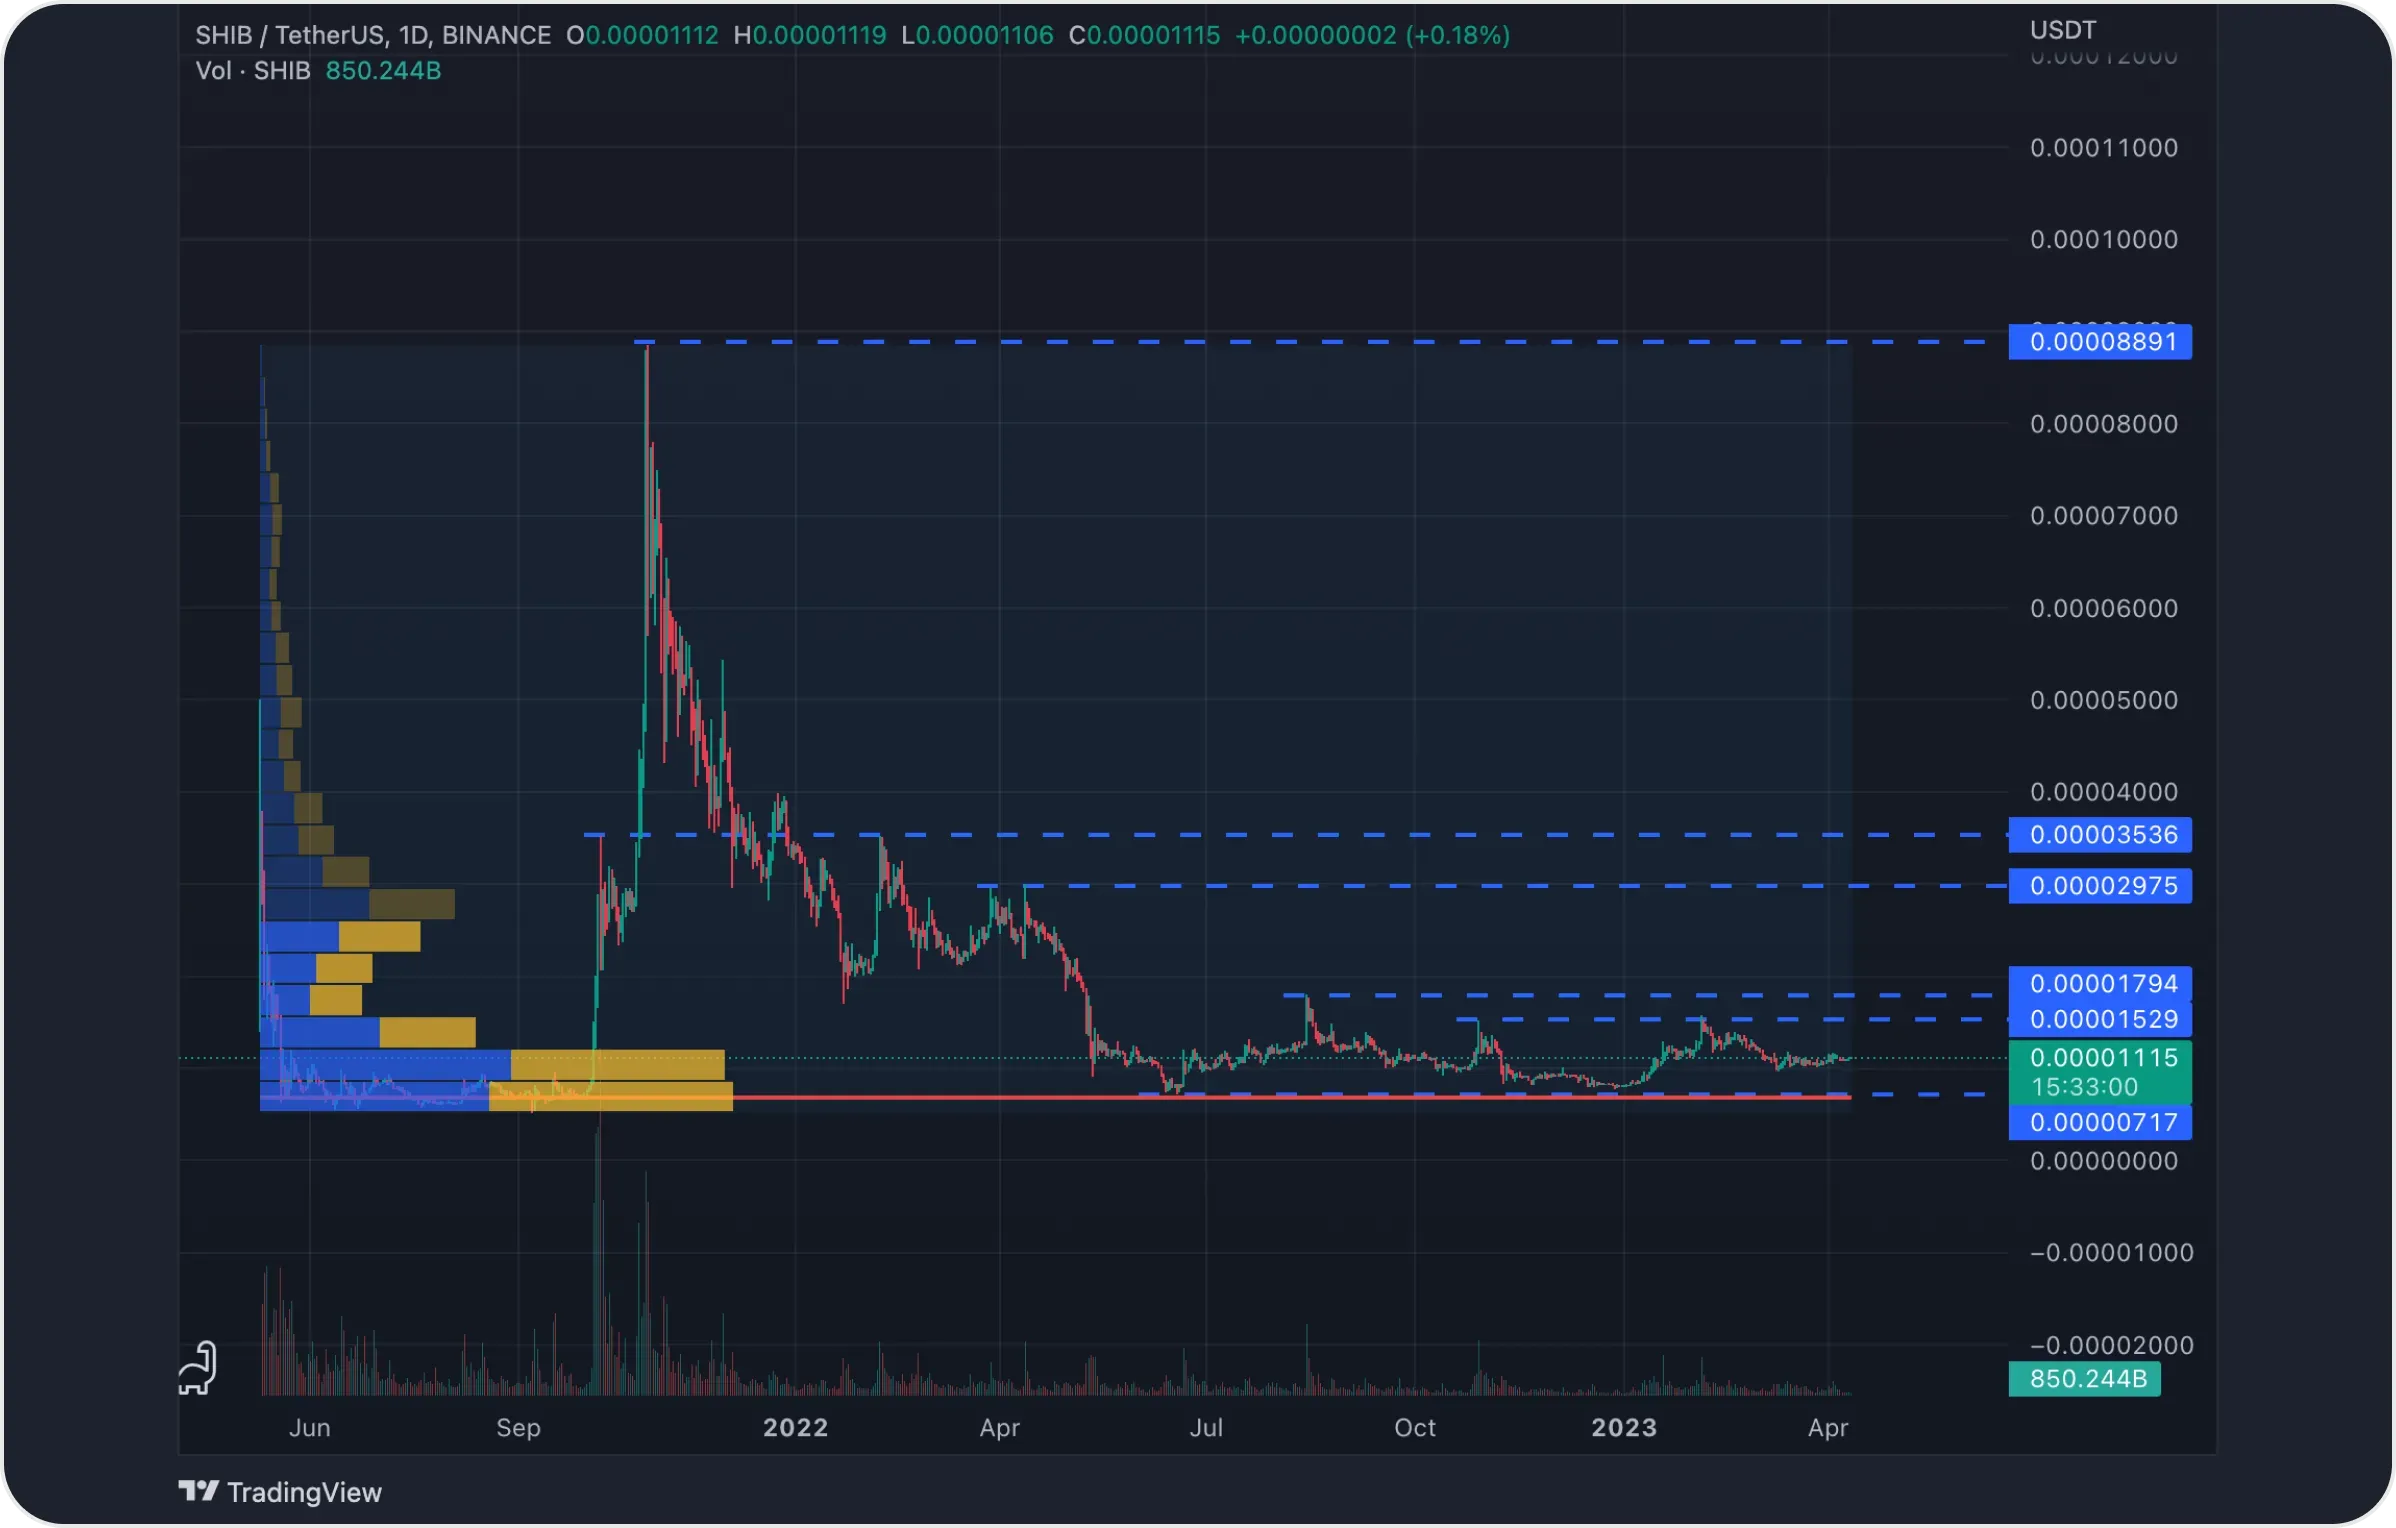
It reached the price mark of $0.00001560 from $0.00000769 with a subsequent correction to the current price values of $0.00001115, which amounted to more than 38%.
The price on the chart is forming an uptrend. It’s broken the downtrend structure with the daily candlestick body on February 4th. According to the volume profile, the strongest support level is at $0.00000684. SHIB is a part of meme world and broadly diversified portfolios.
SHIB Price Prediction
Based on the readings of the volume profile, we can conclude that the coin is currently in the accumulation zone (highlighted in green).
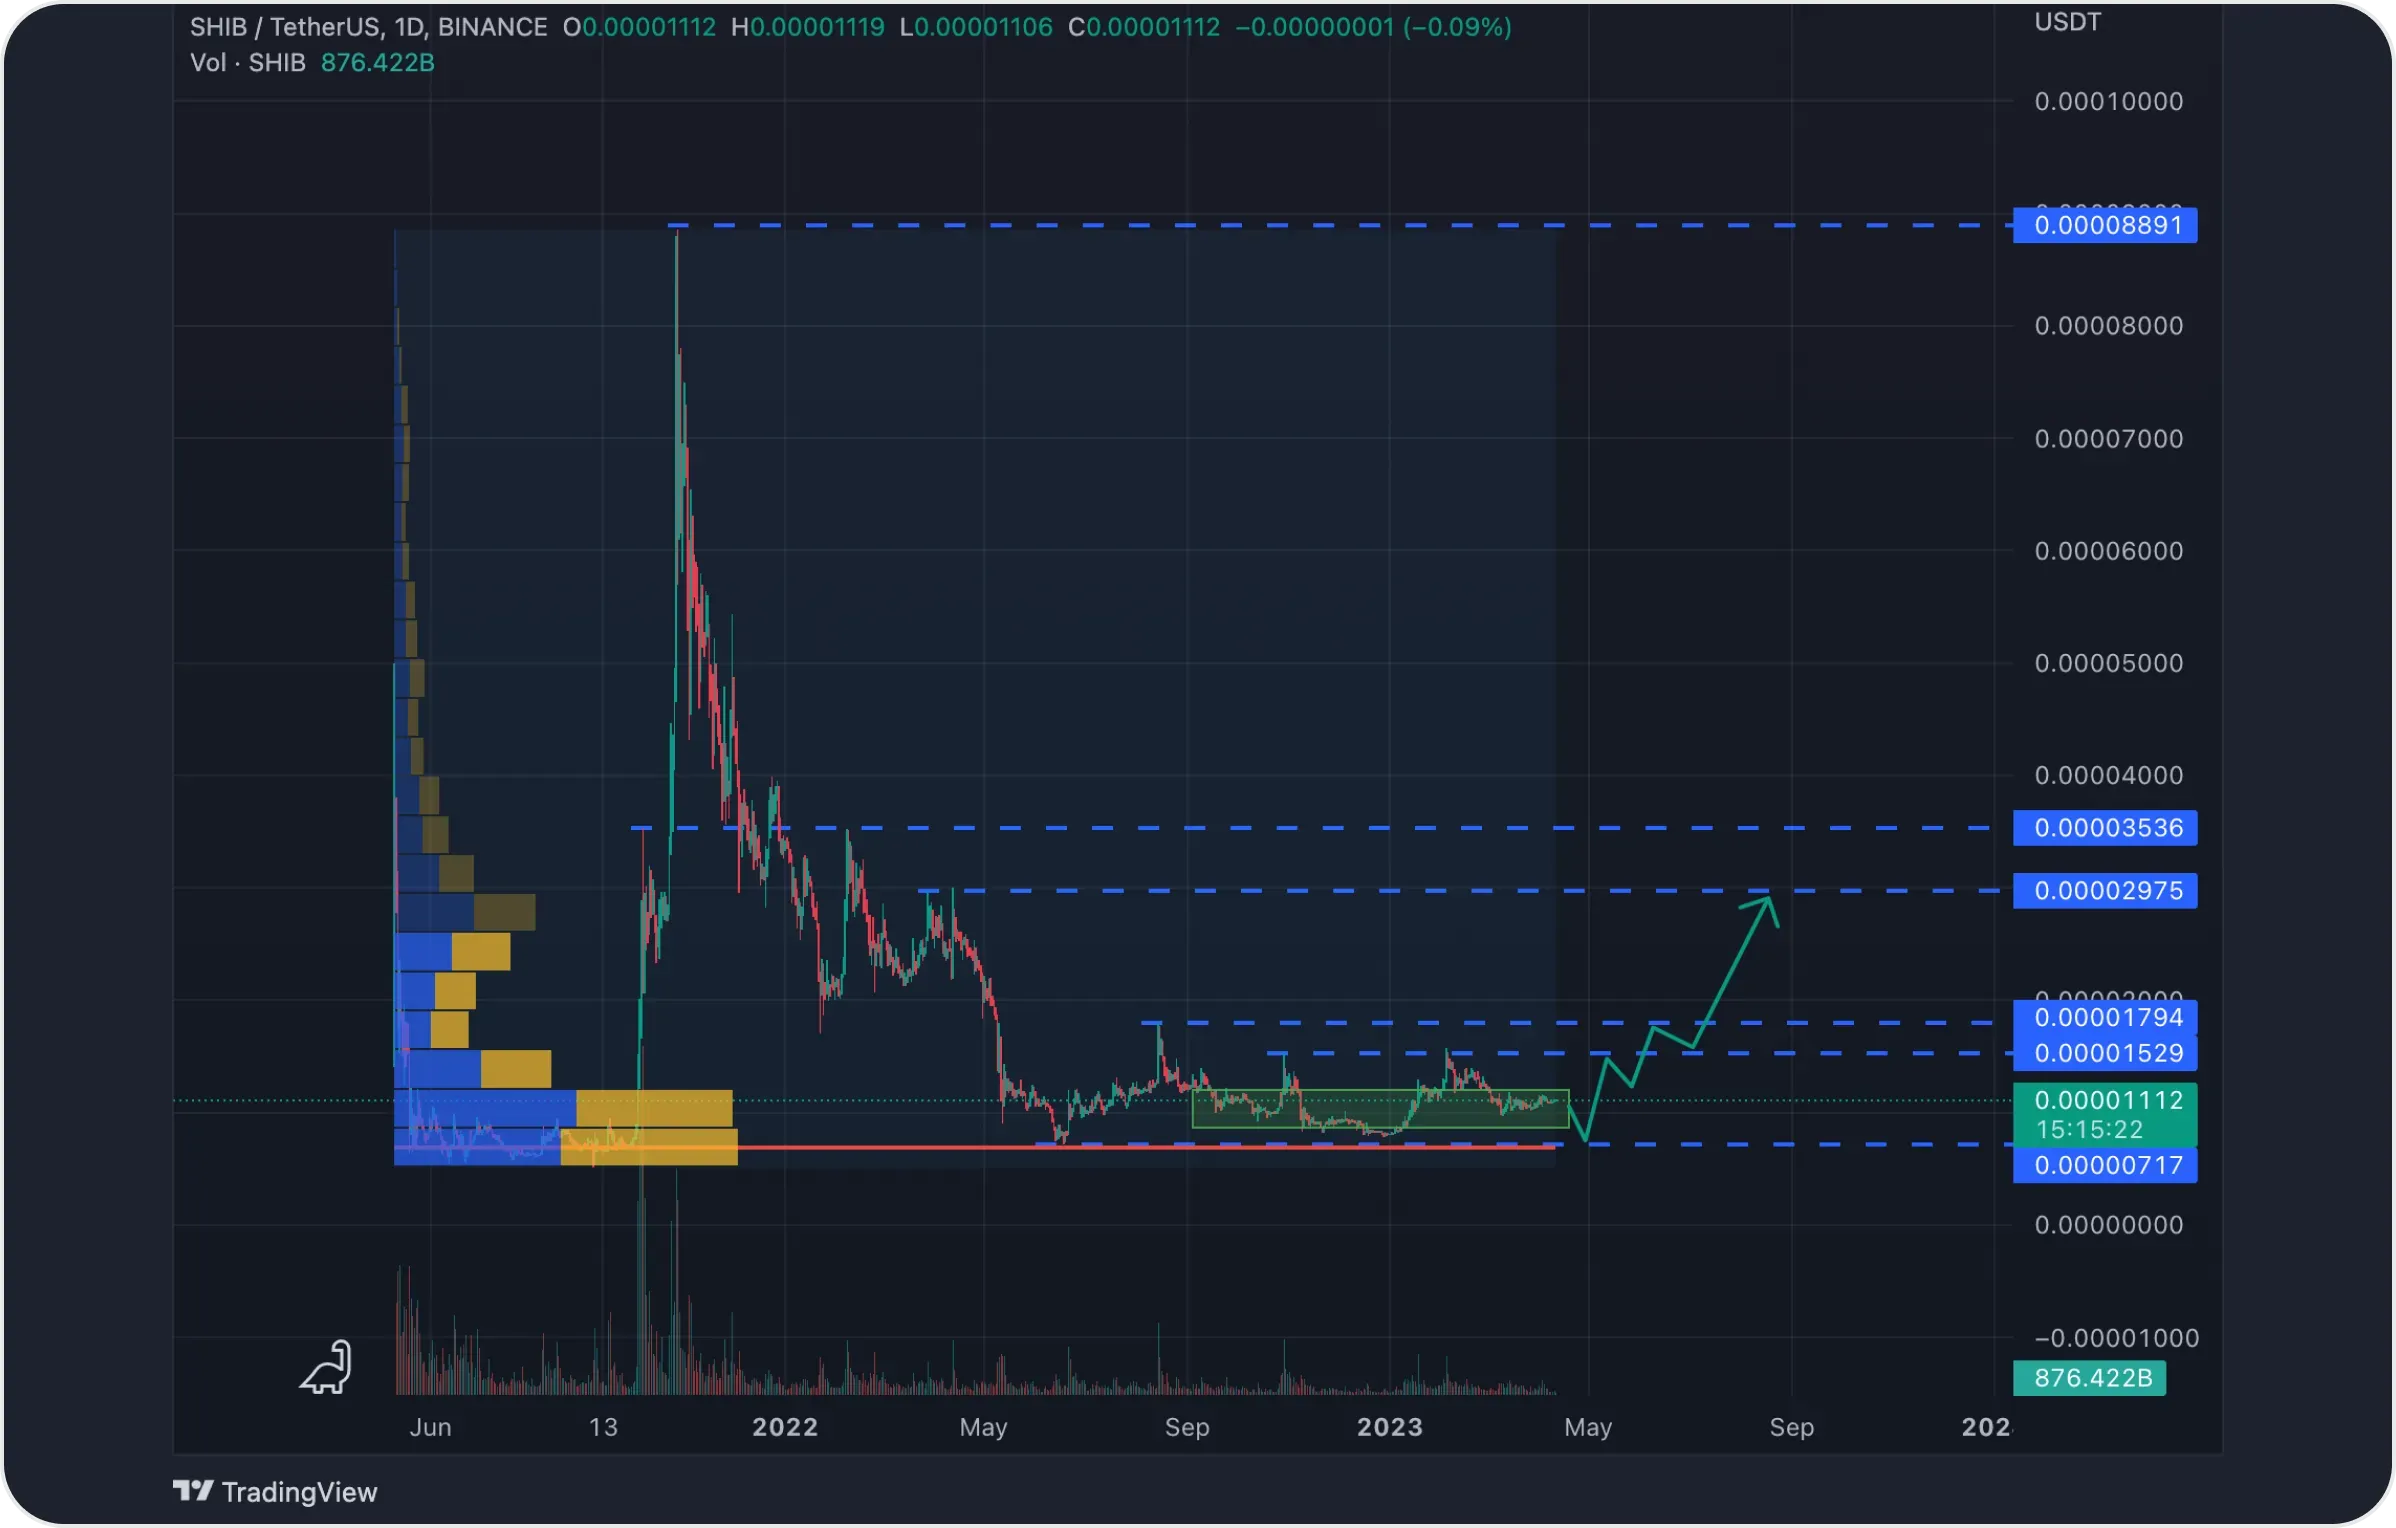
Below is an even larger zone with the PoC level, which acts as the level of maximum support. In the case of a correction to this level, there may be a strong rebound with further price growth.
Despite the good performance, the SHIB coin is still a risk asset.
The information in this article is not a piece of financial advice or any other advice of any kind. The reader should be aware of the risks involved in trading cryptocurrencies and make their own informed decisions. SimpleSwap is not responsible for any losses incurred due to such risks. For details, please see our Terms of Service.