On-chain Analysis Tools

Key Insights
- SOPR indicates when holders are in profit or loss, signalling investor sentiment and demand.
- MVRV Z-Score analyzes overbought/oversold levels relative to fair value, identifying market cycle phases.
- Indicators like HODL Waves, RHODL Ratio, and Active Addresses reveal accumulation patterns and network demand.
On-chain analysis is a set of tools that help analyse data about public Blockchain transactions for a better decision making when trading and investing.
SOPR
SOPR (Spent Output Profit Ratio) is an indicator that helps determine whether BTC holders are in a loss or in profit. Above are units in profit, below - in loss. The indicator uses data such as purchase prices, that is, the incoming transfer of BTC, and sale prices, the further movement of these BTC.
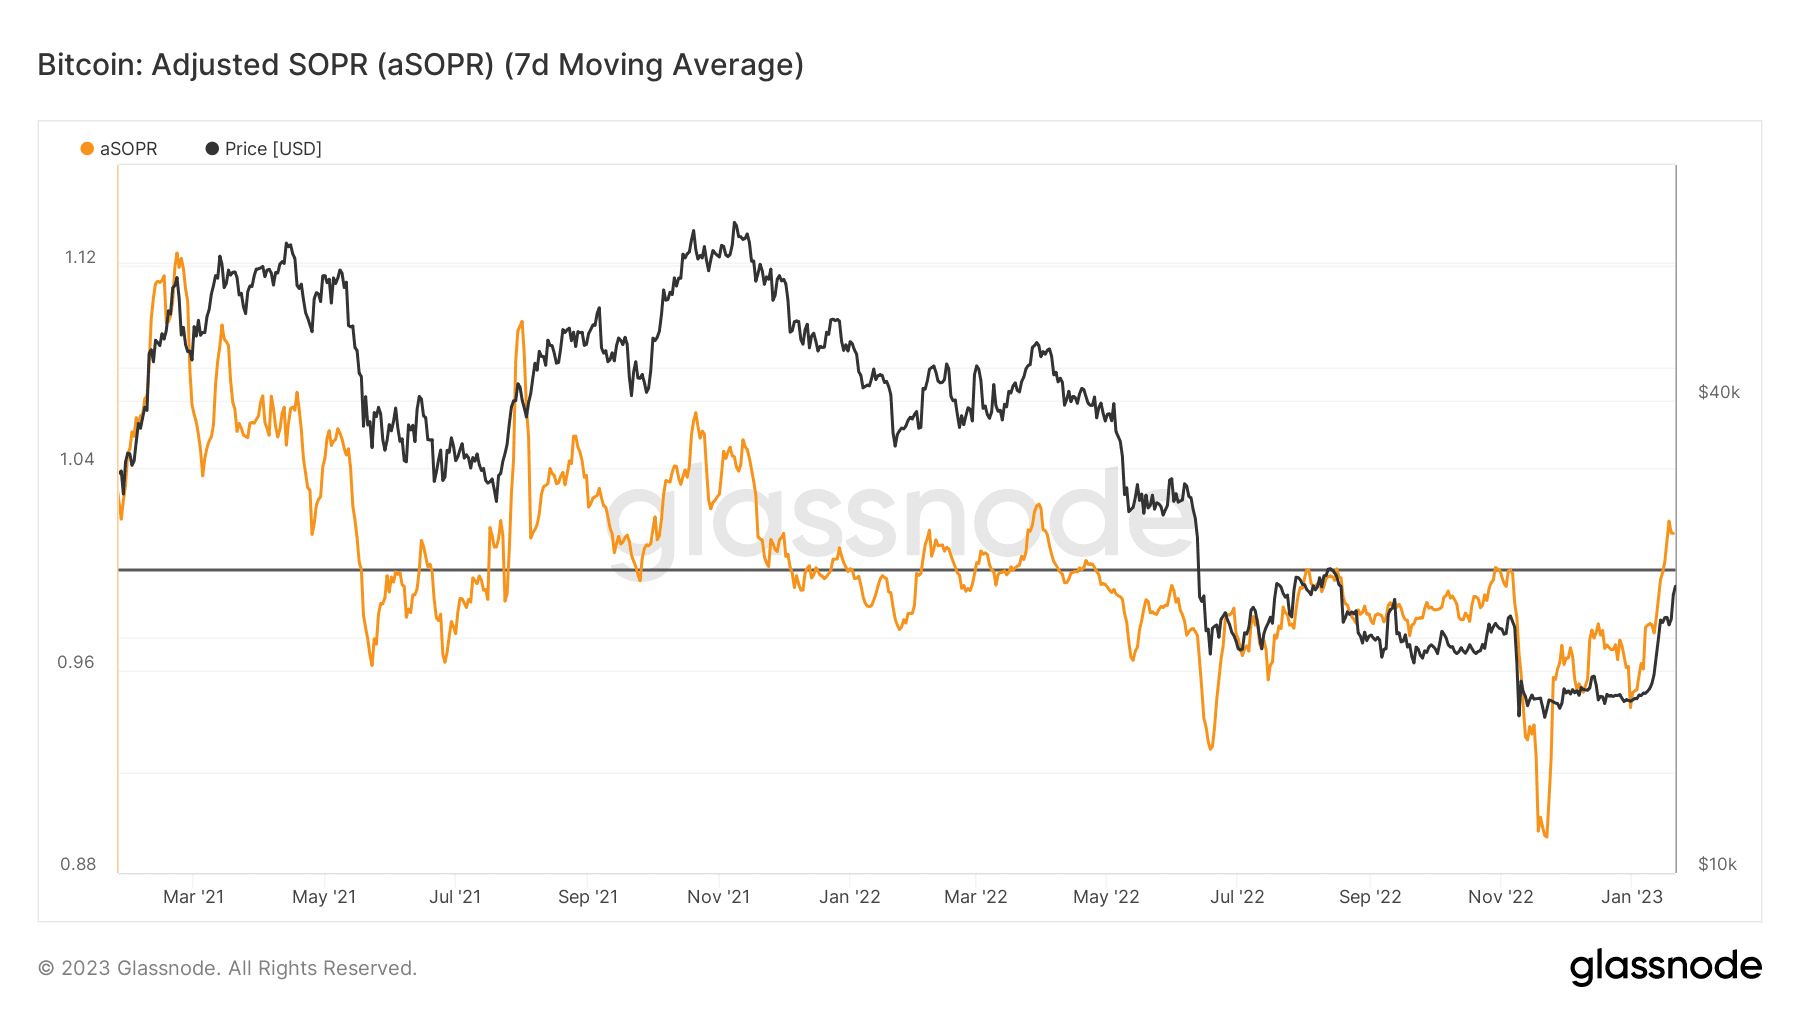
The SOPR analysis tool crossed the 1.0 mark for the first time since the end of April 2022. This demonstrates the positive mood of market participants, as well as sufficient demand from buyers. Besides, it compensates the sales made by participants who want to lock in profits.
Users can get BTC for fiat or other crypto on SimpleSwap.
MVRV Z-Score
MVRV Z-Score is an indicator that analyzes the movement in the blocks of the Bitcoin network and determines the price phase. It is the ratio of overbought and oversold relative to so-called fair value.
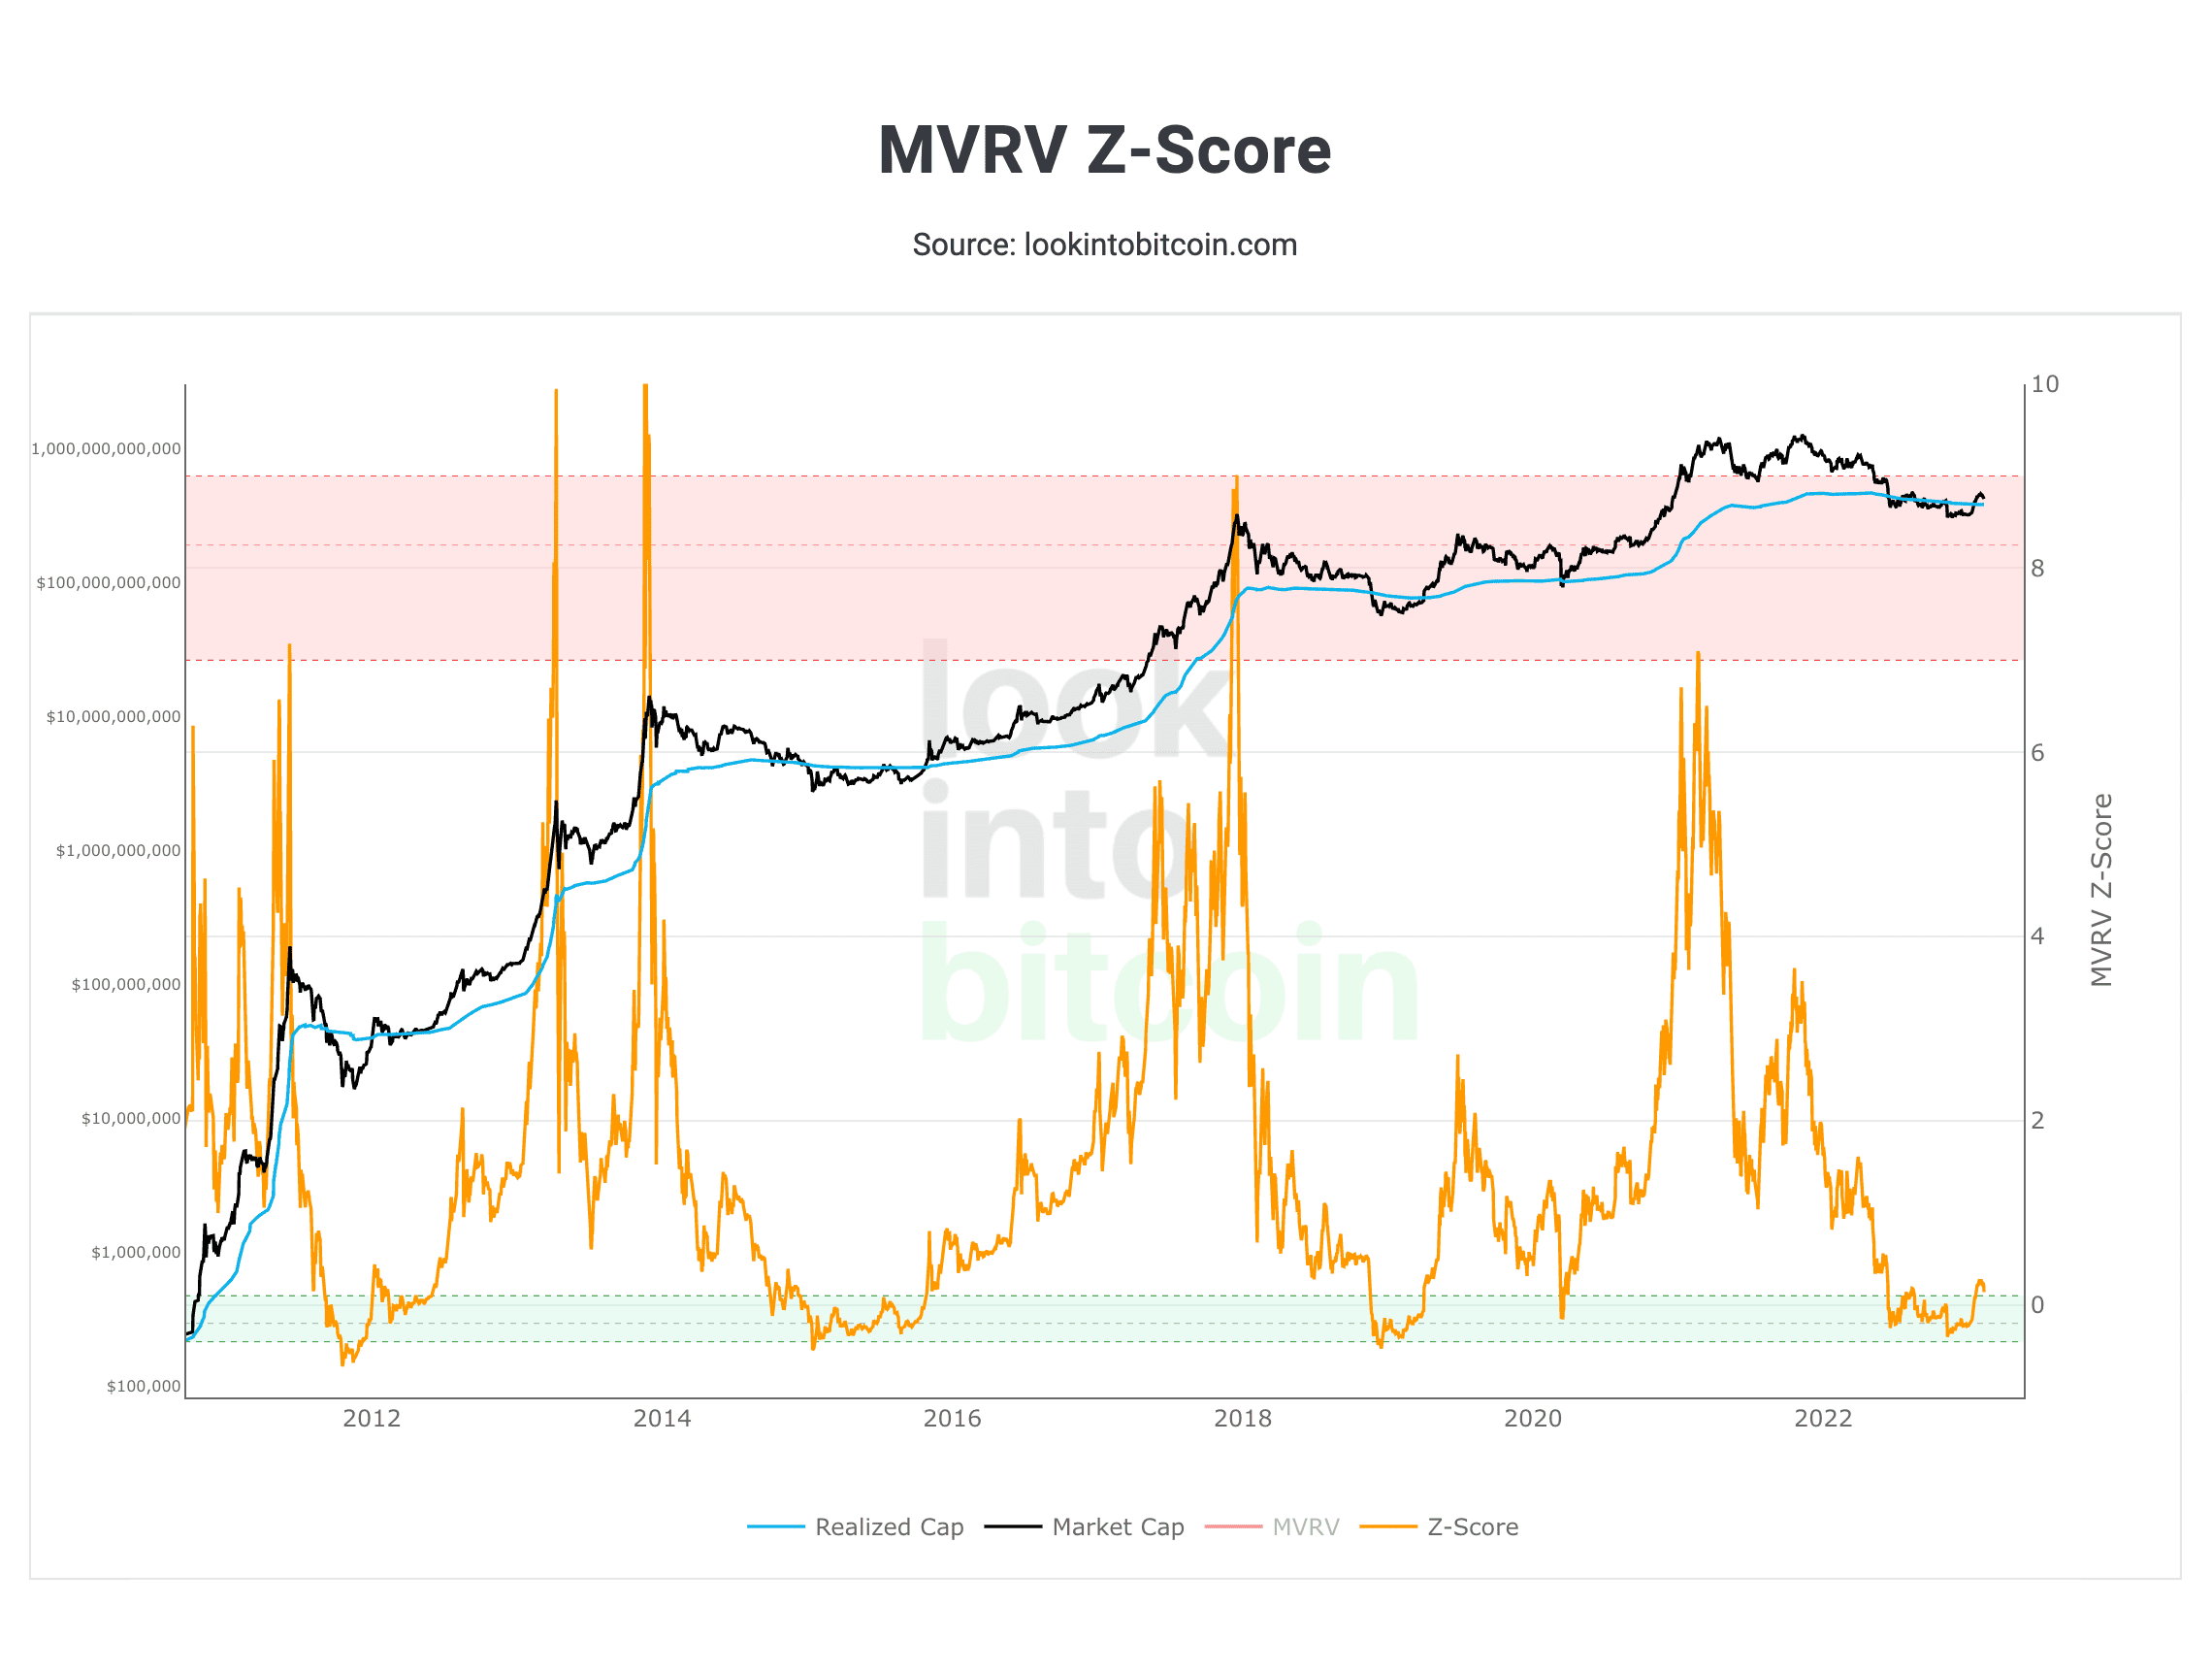
The realized value (orange line) is the average value of the Bitcoin price obtained from the value at the time of the last movement of the coin.
The exit of the chart from the green oversold zone shows that the BTC price has passed the bottom of the bear trend.
HODL Waves
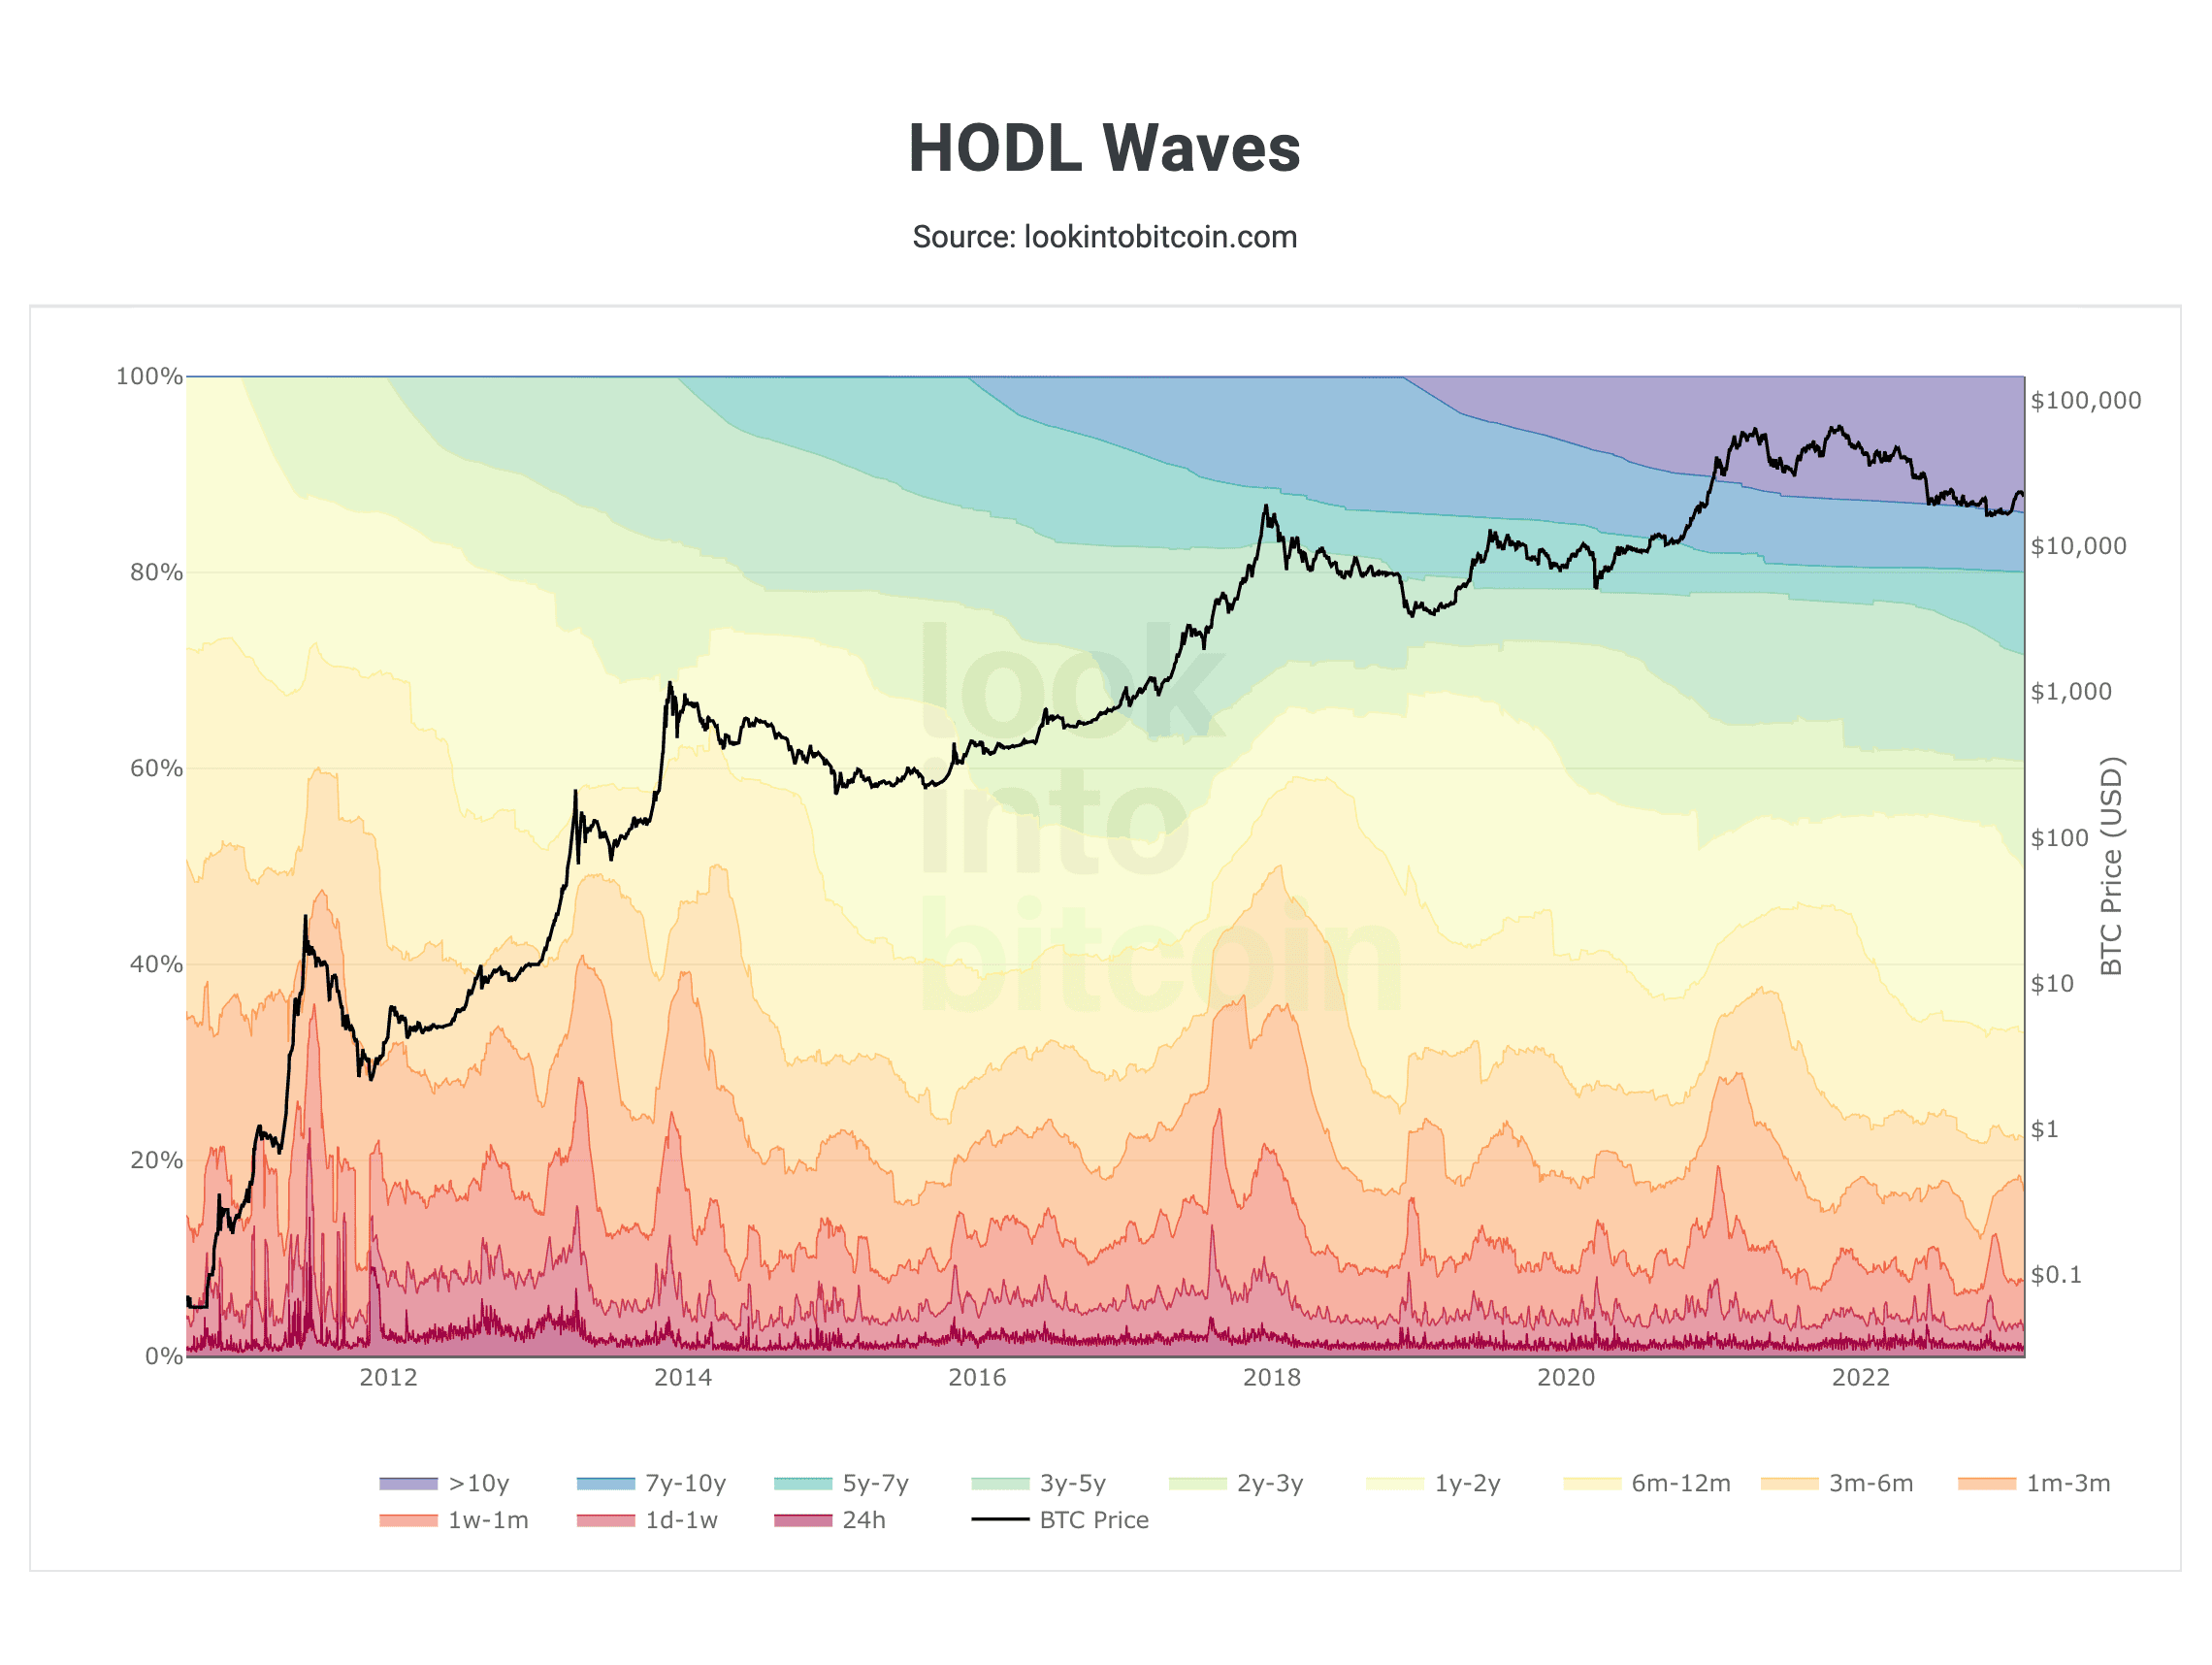
The HODL Waves indicator displays BTC purchases by new participants.
After the peak price of March 7, 2021, interest has cooled down similar to the price peaks of previous bull cycles. At the moment, the indicator displays a surge of interest after the price bottom is passed; this, in turn, confirms the emergence of bulls' interest in the Bitcoin market.
RHODL Ratio
RHODL Ratio is a long-term crypto analysis indicator. It displays the ratio between 1 week RHODL streak and 1-2 years RHODL streak with realized value.
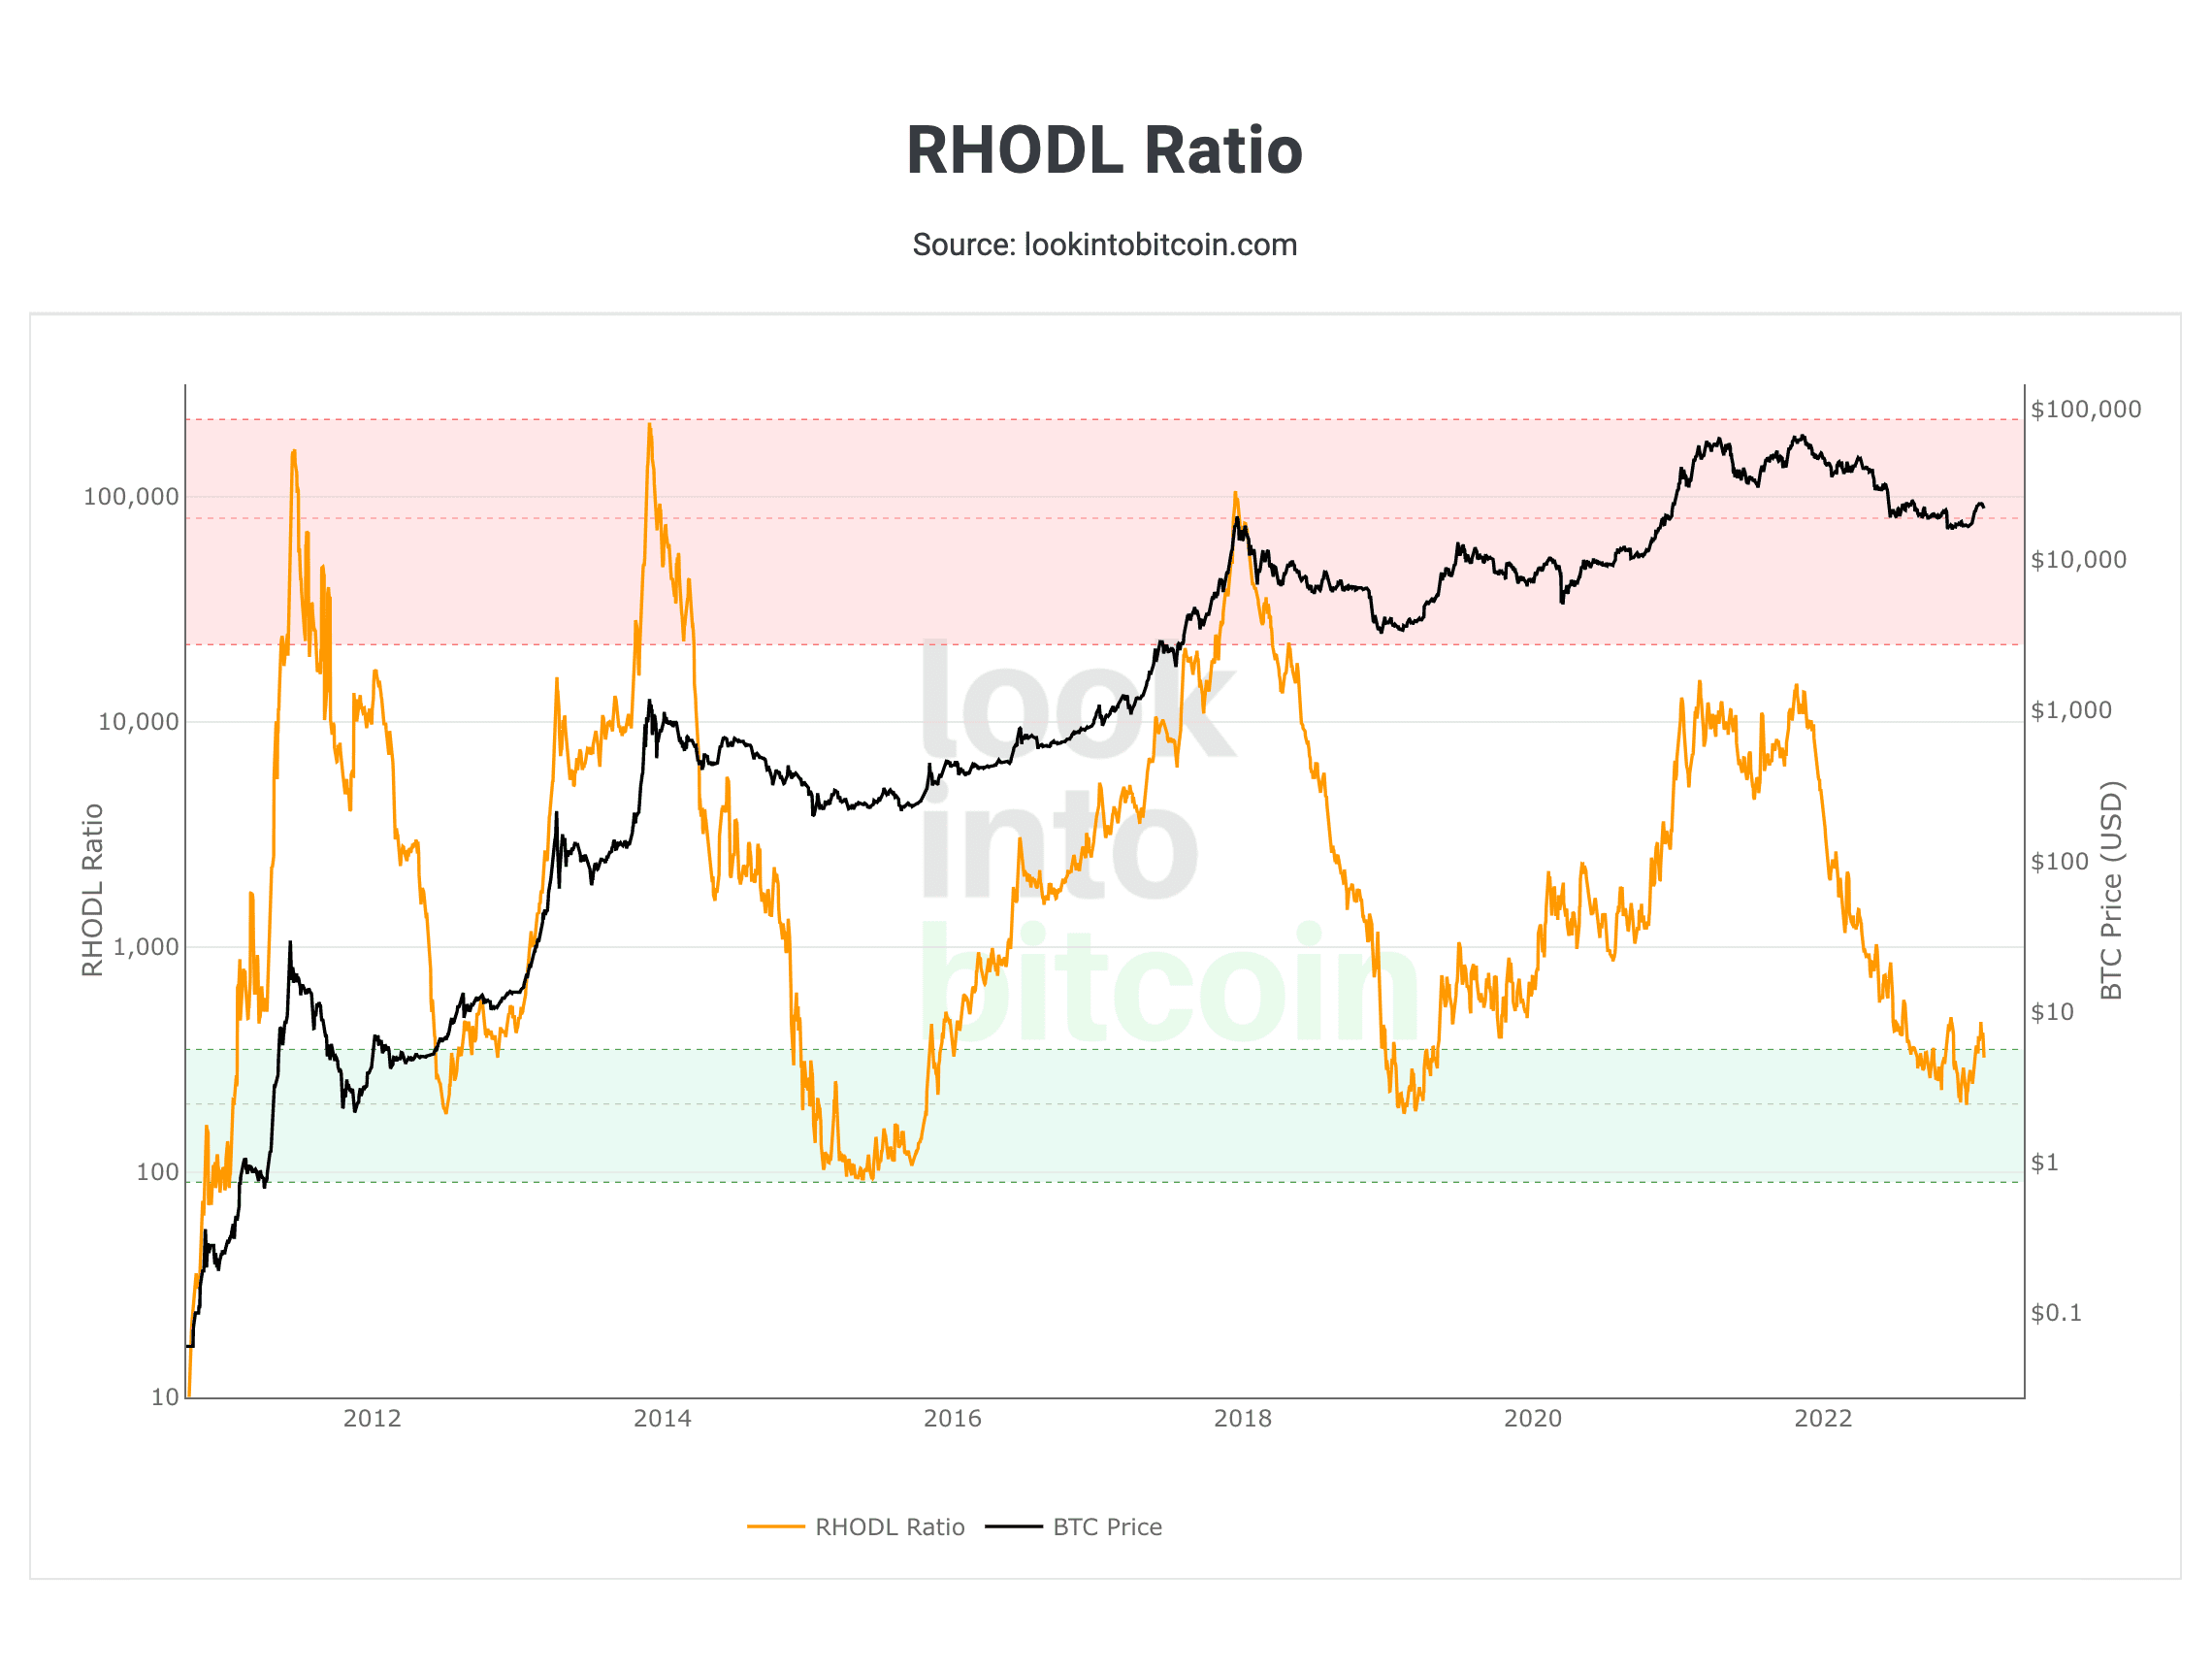
This indicator retests the BTC oversold zone after its re-exit. This indicates a favourable time to buy and start holding the asset.
Bitcoin Active Addresses
Bitcoin Active Addresses is an indicator that displays the number of addresses on the Bitcoin blockchain that have made or received transactions.
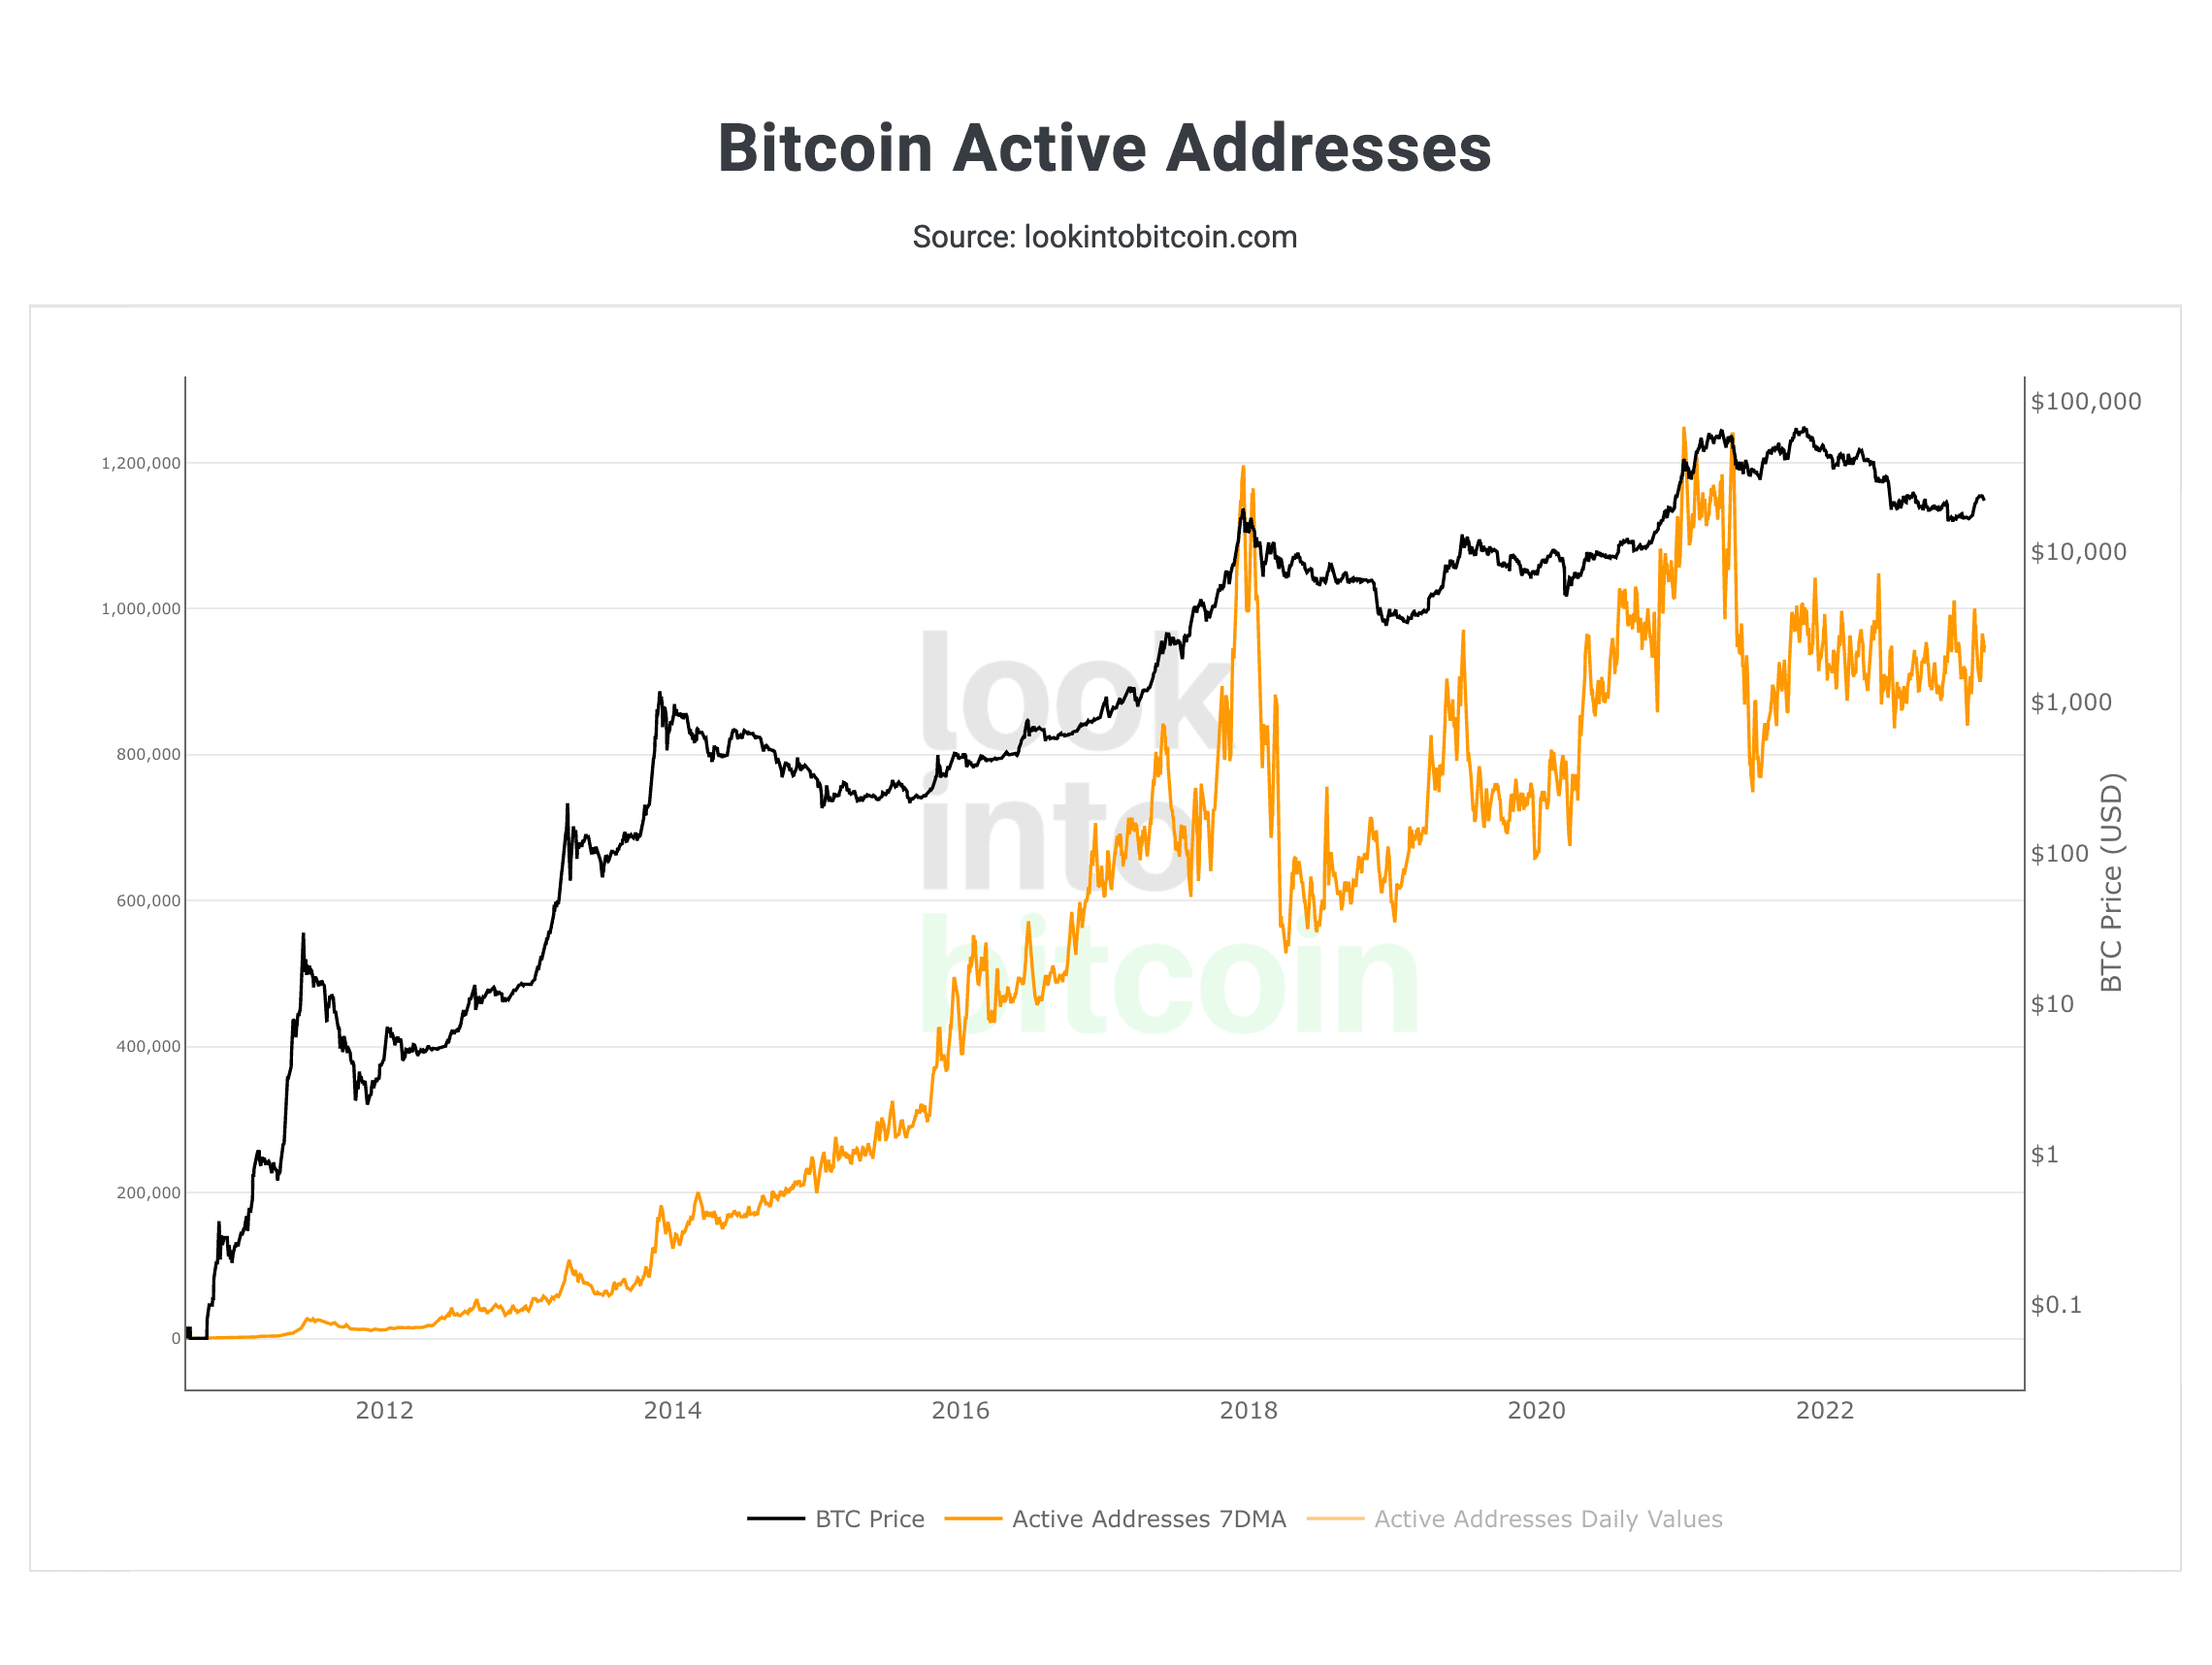
The Bitcoin address indicator shows that the long bear trend didn’t greatly affect the activity inside the Bitcoin blockchain. The network is still in demand. The more indicators one uses, the more advanced their analysis is.
From the Bitcoin On-Chain analysis indicators' point of view, the BTC market downward phase is coming to an end. Interest in the market resumes, money enters the market. This may well indicate the accumulation of positions by investors for a new uptrend.
Summary
Several metrics and tools are used for Bitcoin analysis. Spent Output Profit Ratio (SOPR) is utilised to show whether Bitcoin holders are in a loss or in profit. The HODL Waves reflects Bitcoin purchases by new participants. A long-term RHODL Ratio analysis tool shows the ratio between 1 week RHODL streak and 1-2 years RHODL streak with realized value. Finally, Bitcoin Active Addresses displays the number of Bitcoin addresses on the blockchain that have made or received transactions.
The information in this article is not a piece of financial advice or any other advice of any kind. The reader should be aware of the risks involved in trading cryptocurrencies and make their own informed decisions. SimpleSwap is not responsible for any losses incurred due to such risks. For details, please see our Terms of Service.